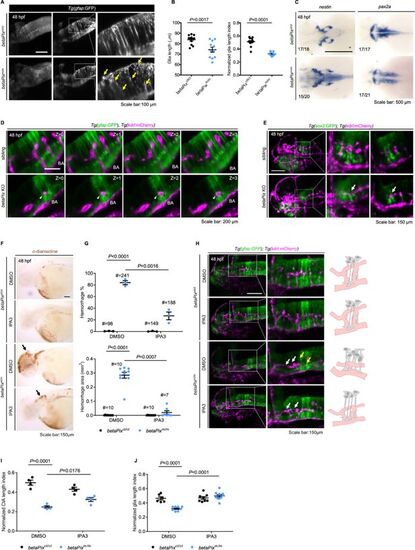
betaPixm/m mutants have brain hemorrhages, central artery defects, and abnormal glial structure that was partially rescued by Pak1 inhibitor IPA-3 treatment. (A) Left panel showing the maximum intensity projection of the glial structures in the hindbrain of betaPixct/ct and betaPixm/m embryos at 48 hpf. Lateral view, anterior to left. Middle panel showing representative optical sections and right panel showing the higher magnifications of boxed area, presenting atypical glial structures with disoriented arrangements (yellow arrows) in betaPixm/m embryos. (B) Quantification of glial parameters in (A). Left panel showing the average glia length, and right panel showing glia length index normalized to individual head length, which each dot represents one embryo. Data are presented in mean ± SEM; unpaired Student’s t-test with individual p-values mentioned in the figure. (C) Whole-mount RNA in situ hybridization revealed nestin and pax2a expression pattern in betaPixct/ct and betaPixm/m embryos at 48 hpf. Dorsal view, anterior to the left. (D) Optical sections of glial structure (green) and blood vessels (magenta) in the heads of siblings and CRISPR-mediated betaPix F0 knockout embryos. Arteries in the hindbrain of betaPix KO mutants had developmental defects (white arrowheads), showing shorter distance between basilar artery and glial cell bodies. (E) 3D reconstruction of the sox2-positive precursors (green) and vasculatures (magenta) in the heads of siblings and CRISPR-mediated betaPix F0 knockout embryos at 48 hpf. Box areas are shown in higher magnifications at the middle panels, with optical sections shown in the right panels. Arrows indicate CtA with enlarged perivascular space. (F) Representative stereomicroscopy images of o-dianisidine staining of betaPixct/ct and betaPixm/m embryos at 48 hpf that were treated with DMSO or PAK inhibitor IPA3. Brain hemorrhages indicated with arrows. (G) Quantification of brain hemorrhagic parameters in (F). Left panel showing hemorrhage percentages, with independent experiments as dots. Right panel showing hemorrhage areas, with each dot representing one embryo, # represents the numbers of embryos scored for each analysis, and three or more individual experiments conducted. Data are presented in mean ± SEM; one-way ANOVA with Dunnett’s test, individual p-values mentioned in the figure. (H) Left panels showing 3D reconstruction of the glial structure (green) and vasculature (magenta) in the heads of betaPixct/ct and betaPixm/m embryos at 48 hpf treated with DMSO or IPA3. Lateral view, anterior to left. Box areas are shown in higher magnifications at the middle panels. Defects in hindbrain central arteries are indicated in white arrows, while defects in radial glia are indicated in yellow arrows. Right panels showing schematic diagrams. Glia (gray) and CtAs (pink) develop normally in DMSO or IPA3-treated betaPixct/ct embryos, with fine radial glial processes and characteristic arch vasculature. Yet in betaPixm/m embryos, abnormal development of the glia and central artery presented. In IPA-3-treated betaPixm/m embryos, central arterial defects were partially rescued with relatively complete arch architecture, and glial process defects were significantly rescued. (I) Quantification of CtA parameters in (H). Left panel showing the average CtA length, and right panel showing the CtA length index normalized to individual head length, with each dot representing one embryo. Data are presented in mean ± SEM; one-way ANOVA with Dunnett’s test, individual p-values mentioned in the figure. (J) Quantification of glia parameters in (H). Left panel showing the average glia length, and right panel showing glia length index normalized to individual head length, which each dot represents one embryo. Individual scale bars are indicated in the figure. Data are presented in mean ± SEM; one-way ANOVA with Dunnett’s test, individual p-values mentioned in the figure. Individual scale bars are indicated in the figure. BA, basilar artery.
|
