
Fig. 4 - Supplemental 1
- ID
- ZDB-FIG-260217-15
- Publication
- Chiu et al., 2026 - Glial betaPix is essential for blood vessel development in the zebrafish brain
- Other Figures
- All Figure Page
- Back to All Figure Page
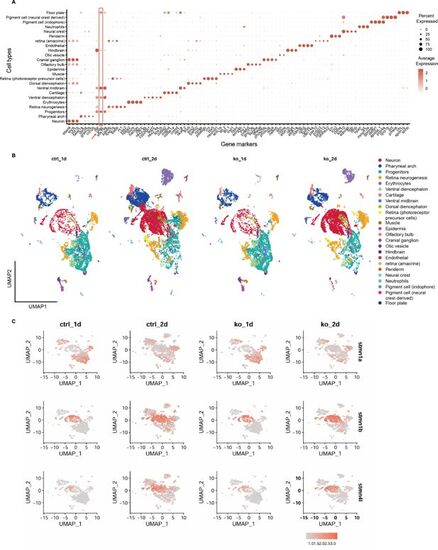
Glial progenitor sub-cluster of betaPix knockouts has downregulation of stathmin family members and up-regulation of pak1 gene. (A) Dot plot of marker genes expression in each cell type. Dot size indicates the percentage of cells expressed, and dot color represents the average expression level. Box area and arrow highlighting gfap expressions. Clusters with high gfap levels, including neuronal and glial progenitors, hindbrain, ventral diencephalon, ventral midbrain, and floor plate. (B) UMAP visualization and clustering of cells labeled by cell type across four sample groups. (C) UMAP feature plots displaying relative expression levels of selected transcripts among four sample groups. Cells are colored by expression level. |