
Fig. 3 - Supplemental 2
- ID
- ZDB-FIG-260217-13
- Publication
- Chiu et al., 2026 - Glial betaPix is essential for blood vessel development in the zebrafish brain
- Other Figures
- All Figure Page
- Back to All Figure Page
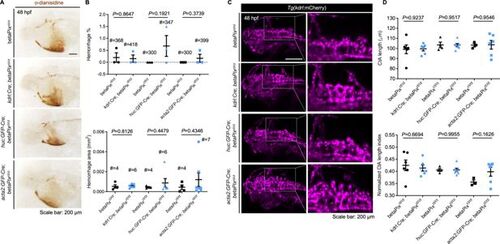
Neither endothelial-, neuronal-, nor mural-specific deletion of betaPix caused brain hemorrhages and abnormal CtA phenotypes. (A) Representative stereomicroscopy images of o-dianisidine staining in betaPixct/ct, kdrl:Cre; betaPixct/ct, huC:GFP-Cre; betaPixct/ct, and acta2:GFP-Cre; betaPixct/ct embryos at 48 hpf. (B) Quantification of hemorrhage parameters in (A). Top panel showing hemorrhage percentages, with independent experiment as dot. Down panel showing hemorrhage areas with each dot representing one embryo. # represents the numbers of embryos scored for each analysis, three or more individual experiments conducted. Data are presented in mean ± SEM; unpaired Student’s t-test with individual p-values mentioned in the figure. (C) 3D reconstruction of the vasculature of betaPixct/ct, kdrl:Cre; betaPixct/ct, huC:GFP-Cre; betaPixct/ct, and acta2:GFP-Cre; betaPixct/ct embryos at 48 hpf. Lateral view with anterior to left. Boxed areas of the hindbrains are shown in higher magnifications at the right panels. (D) Quantification of CtA parameters in (C). Top panel showing average CtA length, and down panel showing CtA length index normalized to individual head length, with each dot representing one embryo. Data are presented in mean ± SEM; unpaired Student’s t-test with individual p-values mentioned in the figure. Individual scale bars are indicated in the figure. |