
Fig. 2 - Supplemental 2
- ID
- ZDB-FIG-260217-10
- Publication
- Chiu et al., 2026 - Glial betaPix is essential for blood vessel development in the zebrafish brain
- Other Figures
- All Figure Page
- Back to All Figure Page
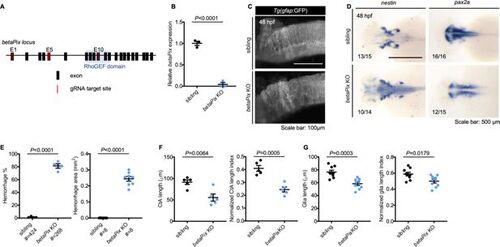
CRISPR-mediated betaPix F0 knockouts had similar phenotypes as betaPixm/m mutants. (A) Schematic diagram illustrates guide RNA sites for CRISPR-mediated betaPix F0 knockout. E, exon. (B) qRT-PCR revealing that betaPix decreased in CRISPR-mediated betaPix F0 knockout embryos compared with wild-type siblings at 48 hpf. Each dot represents one embryo. Data are presented in mean ± SEM; unpaired Student’s t-test with individual p-values mentioned in the figure. (C) Maximal intensity projection of the glial structure of the hindbrains in siblings and CRISPR-mediated betaPix F0 knockouts at 48 hpf, lateral view with anterior to left. (D) Whole-mount RNA in situ hybridization revealing up-regulated nestin and downregulated pax2a expression in CRISPR-mediated betaPix F0 knockout embryos at 48 hpf. Dorsal view with the anterior to the left. (E) Quantification of hemorrhagic parameters of siblings and CRISPR-mediated betaPix F0 knockout embryos at 48 hpf. Left panel showing hemorrhage percentages, with independent experiment as dot. Right panel showing hemorrhage areas with each dot representing one embryo. # represents the numbers of embryos scored for each analysis, three or more individual experiments conducted. Data are presented in mean ± SEM ; unpaired Student’s t-test with individual p-values mentioned in the figure. (F) Quantification of CtA parameters of siblings and CRISPR-mediated betaPix F0 knockout embryos at 48 hpf. Left panel showing average CtA length, and right panel showing CtA length index normalized to individual head length, with each dot representing one embryo. Data are presented in mean ± SEM; unpaired Student’s t-test with individual p-values mentioned in the figure. (G) Quantification of glial parameters of siblings and CRISPR-mediated betaPix F0 knockout embryos at 48 hpf. Left panel showing average glia length, and right panel showing glia length index normalized to individual head length, with each dot representing one embryo. Data are presented in mean ± SEM; unpaired Student’s t-test with individual p-values mentioned in the figure. Individual scale bars are indicated in the figure. |