
Fig. 6 - Supplemental 1
- ID
- ZDB-FIG-260217-19
- Publication
- Chiu et al., 2026 - Glial betaPix is essential for blood vessel development in the zebrafish brain
- Other Figures
- All Figure Page
- Back to All Figure Page
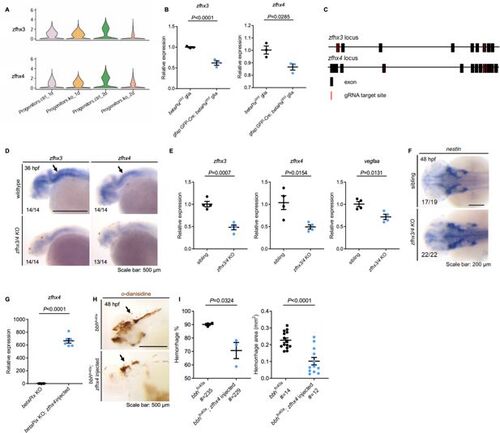
Zfhx3/4 acts downstream of betaPix to regulate vascular integrity development. (A) Violin plots showing that Zfhx3 and Zfhx4 decreased in progenitor sub-cluster of betaPix knockouts. (B) qRT-PCR analysis revealing that Zfhx3 and Zfhx4 decreased in FACS-sorted glia of gfap:GFP-Cre; betaPixct/ct mutants compared with betaPixct/ct siblings at 48 hpf. Each dot represents the cells sorted from one embryo. Data are presented in mean ± SEM; unpaired Student’s t-test with individual p-values mentioned in the figure. (C) Schematic diagram illustrates four-guide RNAs mediated F0 knockout strategy in the Zfhx3 and Zfhx4 loci. (D) Whole-mount RNA in situ hybridization confirming Zfhx3/4 efficiency in CRISPR-mediated Zfhx3/4 F0 knockout embryos at 48 hpf. Arrows indicate significant reduction of Zfhx3 and Zfhx4 levels in hindbrain by Zfhx3/4 double knockout. (E) qRT-PCR analysis revealing that Zfhx3, Zfhx4, and Vegfaa decreased in CRISPR-mediated Zfhx3/4 F0 knockout embryos at 36 hpf. Data are presented in mean ± SEM; unpaired Student’s t-test with individual p-values mentioned in the figure. (F) Whole-mount RNA in situ hybridization revealing that nestin increased in CRISPR-mediated Zfhx3/4 F0 knockout embryos at 36 hpf. Arrows indicate the hindbrain regions. (G) qRT-PCR analysis confirming overexpression of Zfhx4 in CRISPR-mediated betaPix F0 knockout embryos with Zfhx4 mRNA injection at 70% epiboly. Data are presented in mean ± SEM; unpaired Student’s t-test with individual p-values mentioned in the figure. (H) Representative stereomicroscopy images of erythrocytes stained with o-dianisidine showing that brain hemorrhages (arrows) decreased in bbhfn40a mutants with Zfhx4 mRNA injection at 48 hpf. Lateral views with anterior to the left. (I) Quantification of hemorrhagic parameters in (H). Left panel showing hemorrhage percentages, with independent experiment as dot. Right panel showing hemorrhage areas with each dot representing one embryo. # represents the numbers of embryos scored for each analysis, three or more individual experiments conducted. Data are presented in mean ± SEM; unpaired Student’s t-test with individual p-values mentioned in the figure. Individual scale bars are indicated in the figure. |