|
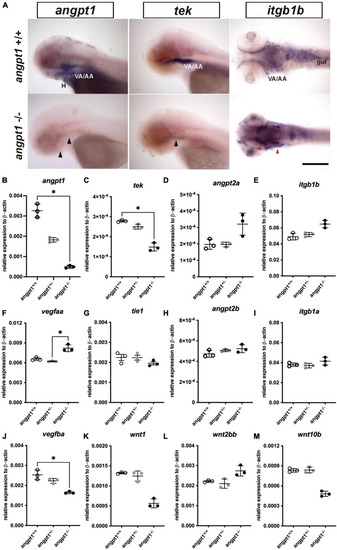
mRNA expression levels of angiogenic factors in 3-dpf angpt1–/– larvae. (A) Expression patterns of angpt1, tek, and itgb1b in 3-pf angpt1+/+ and angpt1–/– larvae done by WISH. Quantification of mRNA levels done by qPCR using 3-dpf angpt1+/+, angpt1±, and angpt1–/– larvae shown in (B)angpt1; (C)tek; (D)angpt2a; (E)itgb1b; (F)vegfaa; (G)tie 1; (H)angpt2b; (I)itgb1a F; (J)vegfba(K)wnt1; (L)wnt2bb; (M)wnt10b level. Samples were genotyped with HRM analysis. N = 6 per group for WISH. N = 3 Replications for qPCR in each genotyped group (10-pooled embryos in one replication). H, heart; VA/AA, ventral aorta/branchial arch. Arrows indicate regions showing differential expression patterns between angpt1+/+ and angpt1–/– larvae, the black one indicating downregulation and the red one showing upregulation. Statistical analysis of qPCR results is shown in mean ± SD by Kruskal–Wallis test with Dunn’s multiple comparisons test. *p < 0.05. Scale bar is 200 μm.
|