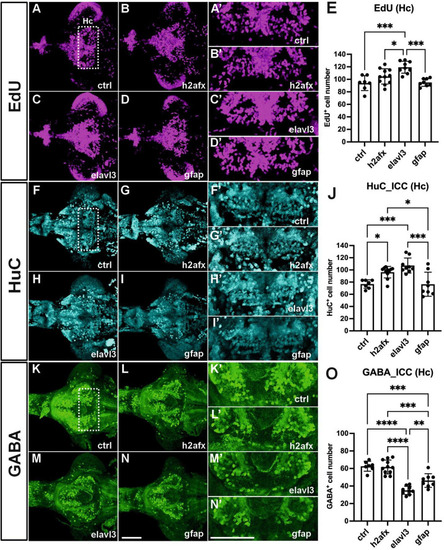
Transgenic expression of zebrafish angpt1 increases proliferation and HuC-positive cells but reduces GABAergic neurons. 5-dpf dissected brains were collected from Turku wild-type embryos injected with Tol2 constructs, including control or angpt1 transgene driven by h2afx, elavl3, and gfap promoter at the one-cell stage. Brain samples were stained with anti-HuC and anti-GABA antibodies following the EdU assay. EdU-proliferation images shown in (A) control (B)h2afx: angpt1(C)elavl3: angpt1(D)gfap: angpt1(E) Quantification of EdU-positive cell numbers in the Hc region [N = 7–11 per injected group, F(3, 31) = 10.75 P < 0.0001]. HuC-immunostaining images shown in (F) control (G)h2afx: angpt1(H)elavl3: angpt1(I)gfap: angpt1(J) Quantification of HuC-positive cell numbers in the Hc region [N = 7–11 per injected group, F(3, 31) = 11.58, P < 0.0001]. GABA-immunostaining images show (K) control (L)h2afx: angpt1(M)elavl3: angpt1(N)gfap: angpt1(O) Quantification of GABA-positive cell numbers in the Hc region [N = 7–11 per injected group, F(3, 31) = 33.92, P < 0.0001]. (A’–N’) Show the high magnification images corresponding to the white rectangular area in the Hc region shown in (A) and equivalent in (B–N). EdU-positive cells are displayed in magenta, HuC-positive cells in cyan, and GABA-positive cells in green. Hc, caudal hypothalamus. Statistical analysis is shown in mean ± SD by an ordinary one-way ANOVA with the Tukey multiple comparisons test. *p < 0.05, **p < 0.01, ***p < 0.001 and ****p < 0.0001. Scale bar is 200 μm.
|
