IMAGE

FIGURE 2

ID
ZDB-IMAGE-240118-21
Source
Figures for Chen et al., 2024
Image
Figure Caption

FIGURE 2

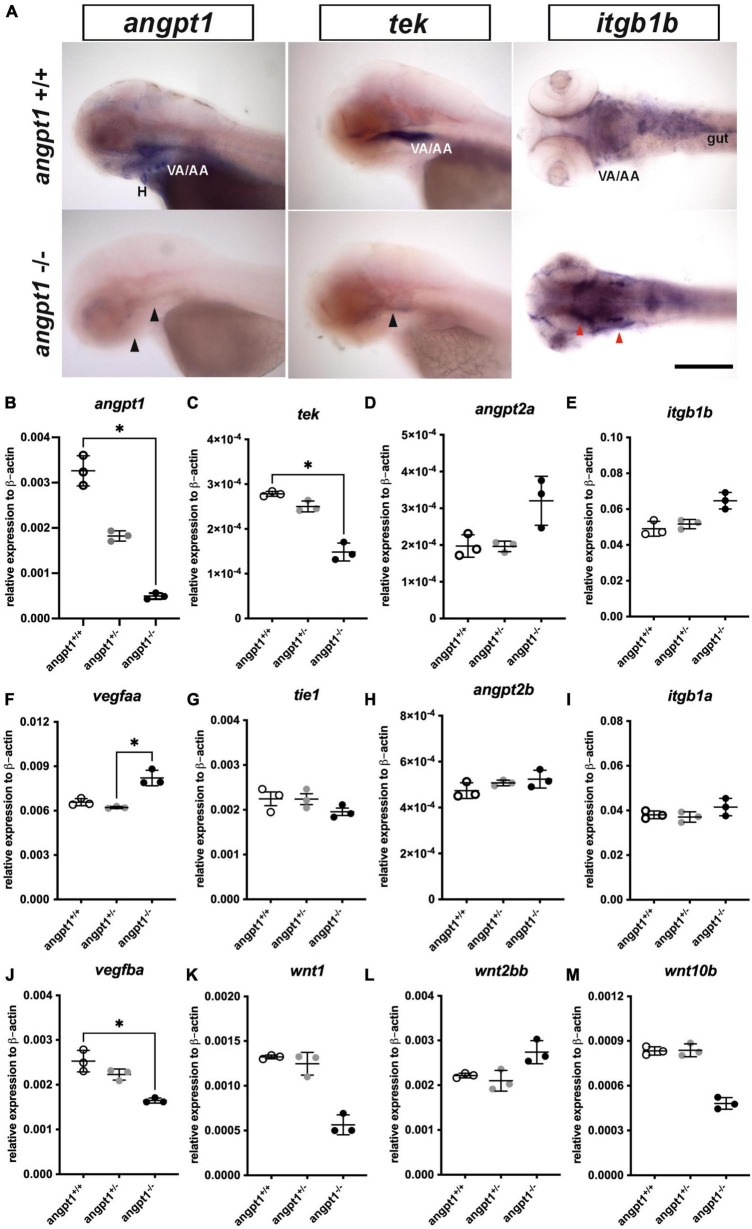
mRNA expression levels of angiogenic factors in 3-dpf angpt1–/– larvae. (A) Expression patterns of angpt1, tek, and itgb1b in 3-pf angpt1+/+ and angpt1–/– larvae done by WISH. Quantification of mRNA levels done by qPCR using 3-dpf angpt1+/+, angpt1±, and angpt1–/– larvae shown in (B)angpt1; (C)tek; (D)angpt2a; (E)itgb1b; (F)vegfaa; (G)tie 1; (H)angpt2b; (I)itgb1a F; (J)vegfba(K)wnt1; (L)wnt2bb; (M)wnt10b level. Samples were genotyped with HRM analysis. N = 6 per group for WISH. N = 3 Replications for qPCR in each genotyped group (10-pooled embryos in one replication). H, heart; VA/AA, ventral aorta/branchial arch. Arrows indicate regions showing differential expression patterns between angpt1+/+ and angpt1–/– larvae, the black one indicating downregulation and the red one showing upregulation. Statistical analysis of qPCR results is shown in mean ± SD by Kruskal–Wallis test with Dunn’s multiple comparisons test. *p < 0.05. Scale bar is 200 μm.

Acknowledgments
This image is the copyrighted work of the attributed author or publisher, and ZFIN has permission only to display this image to its users. Additional permissions should be obtained from the applicable author or publisher of the image. Full text @ Front. Cell. Neurosci.