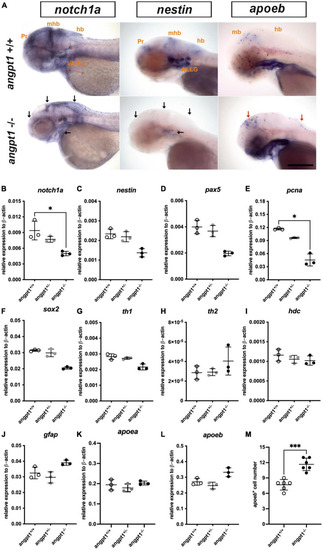
mRNA expression levels of neurogenesis markers in 3-dpf angpt1–/– larvae. (A) Expression patterns of notch1a, nestin (nes), and apoeb in 3-pf angpt1+/+ and angpt1–/– larvae done by WISH. Quantification of mRNA levels done by qPCR using 3-dpf angpt1+/+, angpt1± and angpt1–/– larvae shown in (B)notch1a; (C)nestin; (D)pax5; (E)pcna; (F)sox2; (G)th1; (H)th2; (I)hdc; (J)gfap; (K)apoea; (L)apoeb; (M) Quantification of apoeb-positive cell numbers in the midbrain, N = 6, P = 0.0001. Samples were genotyped with HRM analysis. N = 6 per group for WISH. N = 3 For qPCR, replications in each genotyped group (10-pooled embryos in one replication). ALLG, anterior lateral line ganglion; hb, hindbrain; mhb, midbrain-hindbrain boundary; ov, otic vesicle; Pr, pretectum. Black arrows indicate regions showing decreased expression in angpt1–/– compared with angpt1+/+ larvae. Red arrows indicate regions showing increased angpt1–/– expression compared with angpt1+/+ larvae. Statistical analysis of qPCR results is shown in mean ± SD by the Kruskal–Wallis test with Dunn’s multiple comparisons test. Statistical analysis of apoeb+ cell numbers is shown in mean ± SD by unpaired Student t-test. *p < 0.05, ***p < 0.001. Scale bar is 200 μm.
|
