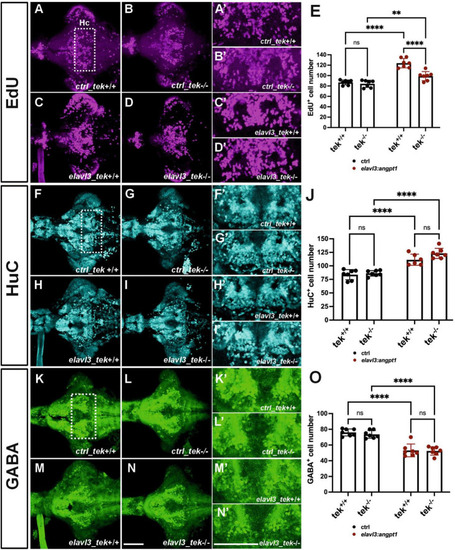
Zebrafish angpt1 regulates neurogenesis in a tek-independent manner. 5-dpf dissected brains were collected from tek+/+ and tek–/– embryos injected with Tol2 constructs including control, angpt1 transgene driven by h2afx, elavl3, or gfap promoter at one-cell stage. The brain samples were stained with anti-HuC and anti-GABA antibodies following the EdU assay. EdU-proliferation images shown in (A) control of tek+/+(B) control of tek–/–(C)tg(elavl3: angpt1) in tek+/+(D)tg(elavl3: angpt1) in tek–/–(E) Quantification of EdU-positive cell numbers in the Hc region (N = 7 per transgene-genotype group, genotype factor F(1, 24) = 23.43, P < 0.0001; transgene factor F(1, 24) = 82.89, P < 0.0001). HuC-immunostaining images show (F) control of tek+/+(G) control of tek–/–(H)tg(elavl3: angpt1) in tek+/+(I)tg(elavl3: angpt1) in tek–/–(J) Quantification of HuC-positive cell numbers in the Hc region [N = 7 per transgene-genotype group, genotype factor F(1, 23) = 4.501, P = 0.0449; transgene factor F(1, 23) = 92.70, P < 0.0001]. GABA-immunostaining images show (K) control of tek+/+(L) control of tek–/–(M)tg(elavl3: angpt1) in tek+/+(N)tg(elavl3: angpt1) in tek–/–(O) Quantification of GABA-positive cell numbers in the Hc region [N = 7–11 per transgene-genotype group, genotype factor F(1, 24) = 0.5009, P = 0.4859; transgene factor F(1, 24) = 98.17, P < 0.0001]. (A’–N’) Show the high magnification images corresponding to the white rectangular area in the Hc region shown in (A) and equivalent in (B–N). EdU-positive cells in magenta, HuC-positive cells in cyan, and GABA-positive cells in green. Hc, caudal hypothalamus. Statistical analysis is shown in mean ± SD by an ordinary two-way ANOVA with Sidak’s multiple comparisons test, with a single pooled variance. **p < 0.01 and ****p < 0.0001. Scale bar is 200 μm.
|
