|
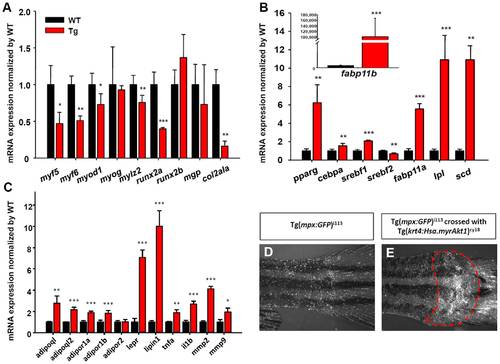
Deregulation of myogenesis-, skeletogenesis-, adipogenesis-, adipocytokine- and inflammation-related genes in Tg(krt4:Hsa.myrAkt1)cy18. Comparison of relative expression level of myogenesis/skeletogenesis- (A), adipogenesis- (B), adipocytokine and inflammatory-related (C) gene transcripts between WT and Tg assayed by real-time RT-PCR. Stars labeled above the error bars indicate significant differences as tested by Student’s t-test.*p<0.05, **p<0.01, and ***p<0.001.Visualization of the inflammatory response (red dotted line) in the tail region of both Tg(mpx:GFP)i113 (D) and double transgenic progeny derived from Tg(mpx:GFP)i113 and Tg(krt4:Hsa.myrAkt1)cy18 crossing (E).WT, wild type; Tg, Tg(krt4:Hsa.myrAkt1)cy18.
|