|
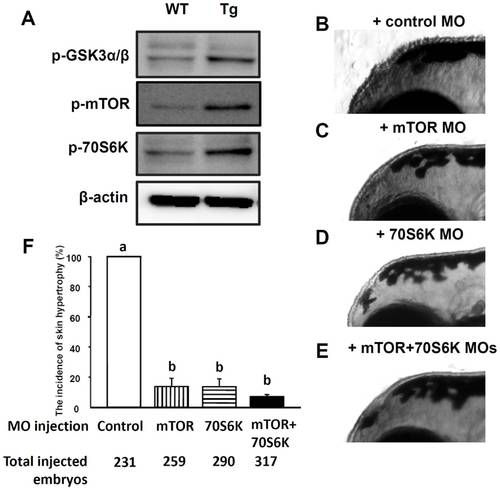
The Akt downstream genes are activated in Tg(krt4:Hsa.myrAkt1)cy18. (A) Western blot analysis of protein lysate extracted from adult tail fins showing that many downstream targets of Akt1 are over-phosphorylated in Tg. β-actin served as a loading control. (B-E) MO knock-down experiment to evaluate whether the skin hypertrophy phenotype can be rescued when Akt activity ceases. Fertilized eggs collected from Tg outcross were injected with either control MO (B), mTOR MO (C), 70S6K MO (D), or mTOR+70S6K MOs (E). The skin hypertrophic appearance was scored at 120 hpf and compared quantitatively (F). MO, morpholino; WT, wild type; Tg, Tg(krt4:Hsa.myrAkt1)cy18; Different letters above the error bars indicate significant differences which tested by one-way ANOVA with Tukey’s pair-wise comparison method. hpf, hour post-fertilization.
|