
- Title
-
Trehalose Treatment in Zebrafish Model of Lafora Disease
- Authors
- Della Vecchia, S., Ogi, A., Licitra, R., Abramo, F., Nardi, G., Mero, S., Landi, S., Battini, R., Sicca, F., Ratto, G.M., Santorelli, F.M., Marchese, M.
- Source
- Full text @ Int. J. Mol. Sci.

Regional and developmental expression of the epm2a gene. (A) qRT−PCR analysis showing epm2a developmental relative expression from 0 hpf to 5 dpf in WT zebrafish. Three independent RNA samples (each obtained from about 30–40 larvae) for each stage. (B) Wholemount in situ hybridization showing epm2a regional expression in 24 hpf WT embryos. |

Generation and morphology of epm2a−/− zebrafish mutants. (A) Coding sequence alignment of wt and mutant epm2a shows the generation of epm2a-null mutant zebrafish by insertion of 5 bp into exon 2 of the epm2a gene. (B) Protein alignment of wt and mutant epm2a. The red rectangle shows the premature stop codon at residue 74 (p.Thr54Asnfs*74) caused by the 5-bp insertion mutation in exon 2. (C) qRT–PCR analysis revealed a decrease in the level of epm2a mRNA expression, normalized to the expression of β-actin mRNA. Three independent RNA samples (each obtained from about 30–40 larvae) from epm2a−/− larvae at 120 hpf and from controls were analyzed. The values are expressed as mean ± standard deviation (SD). **, p ≤ 0.01, calculated by Student’s t-test. (D) Lateral view photographs of representative control and epm2a−/− specimens. At 4 dpf we observed a significant reduction in body length in epm2a−/− larvae (n = 83) compared to WT controls (n = 83), **** p ≤ 0.0001, calculated by Mann-Whitney test. |
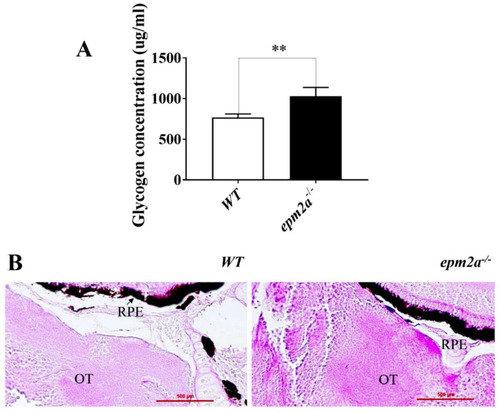
Accumulation of glycogen in epm2a−/− larvae at 5 dpf. (A) Glycogen concentration, expressed in ug/mL, measured in epm2a−/− larvae (n = 30) and WT controls (n = 30) at 5 dpf. The values are expressed as mean ± standard deviation (SD). **, p ≤ 0.01, calculated by Student’s t-test. (B) Histological examination with periodic acid-Schiff staining of the brains of epm2a−/− and WT larvae at five dpf (magnification 40×). Abbreviations: OT, optic tectum; RPE, retinal pigment epithelium. PHENOTYPE:
|
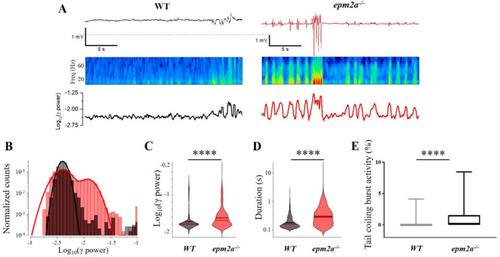
LFP and burst activity recordings in epm2a−/− zebrafish mutants. (A) (Top) Snapshot of 25 s–long extract of LFP signal recorded from 120 hpf WT (left) and epm2a−/− (right) zebrafish showing differences in burst activity. The relative spectrogram (Middle) and power in the 30–95 Hz band computed on a rolling window of 250 ms in steps of 50 ms (Bottom) are also shown. (B) Distribution of the log10 of the power in the 30–95 Hz band from the complete recordings (15 min) of the larvae depicted in panels A and B (WT in black and epm2a−/− in red). (C) and (D) Violin plots of the power and duration of the events detected from all the WT (n = 11) and epm2a−/− (n = 11) fish. Red and black lines indicate medians and means, respectively. (E) Coiling frequency recorded for 60 s at 30 hpf is increased in epm2a−/− embryos (n = 157) with respect to WT controls (n = 174). ****: p ≤ 0.0001 calculated by Mann-Whitney test. |

Locomotor activity in epm2a−/− zebrafish larvae. Automated analysis of spontaneous motor activity recording for 30 min revealed reductions in distance traveled and velocity in epm2a−/− larvae compared with control siblings at 120 hpf (epm2a−/− n = 190; controls n = 152, in 3 independent experiments). Statistical analysis (**** p ≤ 0.0001) was performed using the Mann-Whitney test. PHENOTYPE:
|

Neuroinflammation, apoptotic death, and mitochondrial dysfunction in epm2a−/− zebrafish larvae. (A) Detection of apoptotic cells by acridine orange staining in controls and epm2a−/− mutant embryos at 24 hpf (lateral views) alongside a quantitative analysis of apoptotic cells in WT (n = 40) and epm2a−/− (n = 44) fish. ** p ≤ 0.01, calculated by the Mann-Whitney test. (B) Mitochondrial respiratory analysis of controls (n = 47) and epm2a−/− mutant larvae (n = 48) at 120 hpf. * p ≤ 0.05, calculated by the Mann-Whitney test. (C) qRT–PCR analysis of inflammatory and anti-inflammatory cytokines. (D) qRT–PCR analysis of microglial genes. (E) qRT–PCR analysis of astroglial genes. The mRNA expression levels had been normalized to expression of β-actin. Three independent RNA samples (each obtained from about 30–40 larvae) from controls and epm2a−/− mutant larvae at 120 hpf were analyzed. * p ≤ 0.05, ** p ≤ 0.01, **** p ≤ 0.0001, calculated by Student’s t-test. The values are expressed as mean ± SD. |

Analysis of autophagy in epm2a−/− zebrafish mutants. (A) qRT–PCR analysis of autophagy factors (mtor, tfeb, beclin-1, atg5, atg12, lc3, and p62) normalized to β-actin in epm2a−/− larvae compared with controls at five dpf. Three independent RNA samples (each obtained from about 30–40 larvae) from controls and epm2a−/− mutant larvae at 120 hpf were analyzed. * p ≤ 0.05, ** p ≤ 0.01, *** p ≤ 0.001, calculated by Student’s t-test. The values are expressed as mean ± standard deviation (SD). (B) Three independent larval homogenates from controls (n = 50) and epm2a−/− larvae (n = 50) were tested by Western blotting for the expression of ATG5, LC3–I and LC3–II proteins. The levels of the different proteins were normalized to the expression of β-actin. * p ≤ 0.05 was calculated by Student’s t-test. |
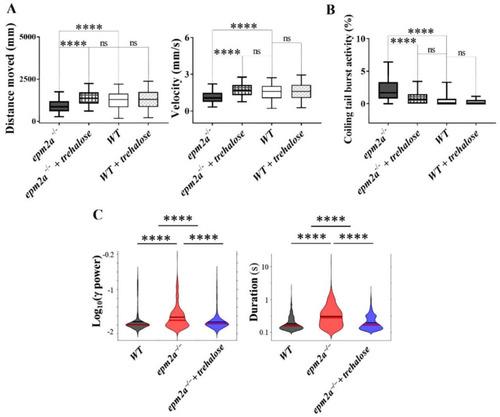
Locomotor, LFP and burst activity recordings after trehalose administration. (A) Locomotion analysis at five dpf in controls (WT) treated (n = 172) and untreated with trehalose (n = 193) and in epm2a−/− mutant larvae treated (n = 213) and untreated with trehalose (n = 228). Statistical analysis (**** p ≤ 0.0001) was performed using the Kruskal-Wallis test. Dunn’s test was used to perform post-hoc analysis for multiple comparisons after the Kruskal-Wallis test. (B) Tail flick analysis performed at 30 hpf in controls (WT) treated (n = 91) and untreated with trehalose (n = 87) as well as in epm2a−/− mutant larvae treated (n = 106) and untreated with trehalose (n = 111). Statistical analysis (**** p ≤ 0.0001) was performed using the Kruskal-Wallis test. Dunn’s test was used to perform post-hoc analysis for multiple comparisons after the Kruskal-Wallis test. ns, not significant (C) Violin plot of the effect of trehalose on the power and duration of detected events, 11 larvae per group were analyzed at five dpf. Statistical analysis (**** p ≤ 0.0001) was performed using the Mann-Whitney test. |