
Fig. 8
- ID
- ZDB-FIG-220627-34
- Publication
- Della Vecchia et al., 2022 - Trehalose Treatment in Zebrafish Model of Lafora Disease
- Other Figures
- All Figure Page
- Back to All Figure Page
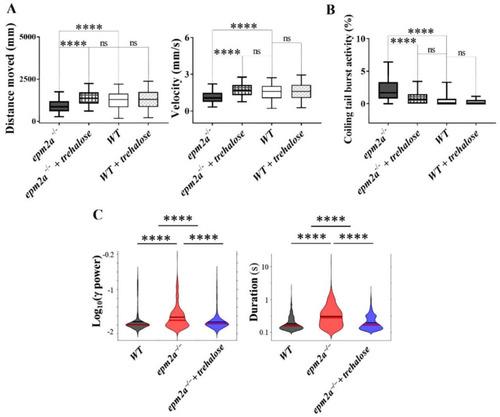
Locomotor, LFP and burst activity recordings after trehalose administration. (A) Locomotion analysis at five dpf in controls (WT) treated (n = 172) and untreated with trehalose (n = 193) and in epm2a−/− mutant larvae treated (n = 213) and untreated with trehalose (n = 228). Statistical analysis (**** p ≤ 0.0001) was performed using the Kruskal-Wallis test. Dunn’s test was used to perform post-hoc analysis for multiple comparisons after the Kruskal-Wallis test. (B) Tail flick analysis performed at 30 hpf in controls (WT) treated (n = 91) and untreated with trehalose (n = 87) as well as in epm2a−/− mutant larvae treated (n = 106) and untreated with trehalose (n = 111). Statistical analysis (**** p ≤ 0.0001) was performed using the Kruskal-Wallis test. Dunn’s test was used to perform post-hoc analysis for multiple comparisons after the Kruskal-Wallis test. ns, not significant (C) Violin plot of the effect of trehalose on the power and duration of detected events, 11 larvae per group were analyzed at five dpf. Statistical analysis (**** p ≤ 0.0001) was performed using the Mann-Whitney test. |
| Fish: | |
|---|---|
| Condition: | |
| Observed In: | |
| Stage Range: | Prim-15 to Day 5 |