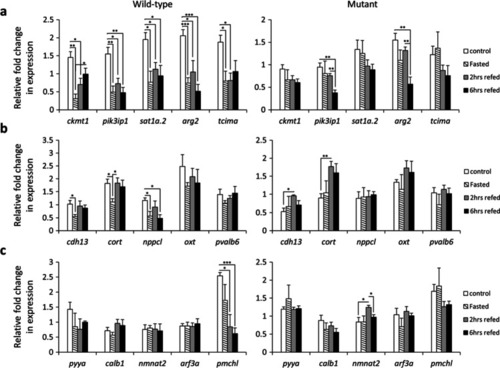
Expression dynamics of selected co-expressed genes within each genotype during the fasting-refeeding experiment. Expression changes of (a) cart-co-expressed genes, (b) crhb-co-expressed genes and (c) gnrh2-co-expressed genes within each genotype. Means and standard errors of fold changes in expression of five biological replicates are shown for each experimental group. Significant differences are indicated by asterisks (*P < 0.05; **P < 0.01; ***P < 0.001)

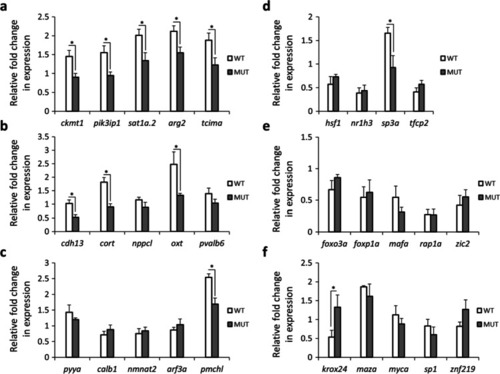
Gene expression differences between the two genotypes, wild-type (WT) and lepr mutant, at normal feeding condition. (ac) Differential expression of genes co-expressed with cart1-4, crhb and gnrh2. (df) Predicted TFs at upstream of cart1-4, crhb and gnrh2 co-expressed modules. Means and standard errors of fold changes in expression of five biological replicates are shown for each experimental group. Significant differences are indicated by asterisks (*P < 0.05)

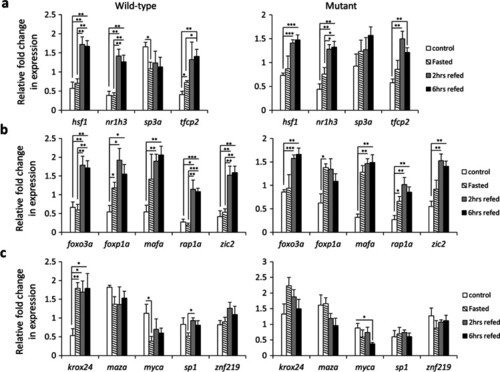
Expression dynamics of predicted upstream regulators of the co-expressed genes within each genotype during the fasting-refeeding experiment. Expression changes of predicted TFs at upstream of (a) cart-co-expressed genes, (b) crhb-co-expressed genes and (c) gnrh2-coexpressed genes within each genotype. Means and standard errors of fold changes in expression of five biological replicates are shown for each experimental group. Significant differences are indicated by asterisks (*P < 0.05; **P < 0.01; ***P < 0.001)

Expression correlations of cart, crhb and gnrh2 related gene regulatory networks and their potential regulatory connections. (a) Pairwise expression correlations between the members of the cart related gene regulatory network in the brain of wild-type and lepr mutant zebrafish in the fasting-refeeding experiment. The plus signs indicate positive Pearson correlation coefficients, and 1 to 3 signs represent significant levels of P < 0.05, P < 0.01 and P < 0.001. The pairwise correlations delineated with black borders are similar between the two genotypes. (b) A schematic illustration of a potential regulatory interaction between leptin signal and cart-/crh-/gnrh2-coexpression modules mediated by sp3a in zebrafish brain

Acknowledgments
This image is the copyrighted work of the attributed author or publisher, and ZFIN has permission only to display this image to its users. Additional permissions should be obtained from the applicable author or publisher of the image. Full text @ Fish Physiol. Biochem.