
FIGURE
Fig. 1
- ID
- ZDB-FIG-210729-32
- Publication
- Ahi et al., 2021 - Transcriptional study reveals a potential leptin-dependent gene regulatory network in zebrafish brain
- Other Figures
- All Figure Page
- Back to All Figure Page
Fig. 1
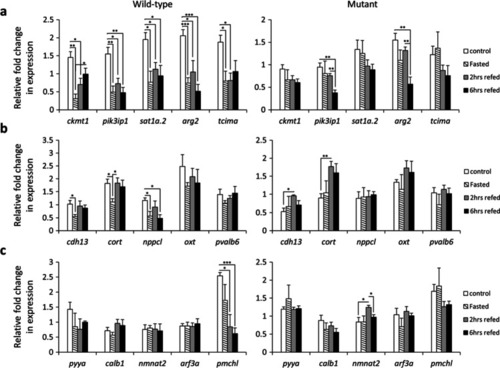
Expression dynamics of selected co-expressed genes within each genotype during the fasting-refeeding experiment. Expression changes of ( |
Expression Data
| Genes: | |
|---|---|
| Fish: | |
| Conditions: | |
| Anatomical Term: | |
| Stage: | Adult |
Expression Detail
Antibody Labeling
Phenotype Data
| Fish: | |
|---|---|
| Conditions: | |
| Observed In: | |
| Stage: | Adult |
Phenotype Detail
Acknowledgments
This image is the copyrighted work of the attributed author or publisher, and
ZFIN has permission only to display this image to its users.
Additional permissions should be obtained from the applicable author or publisher of the image.
Full text @ Fish Physiol. Biochem.