
IMAGE
Fig. 1
Image
|
Figure Caption
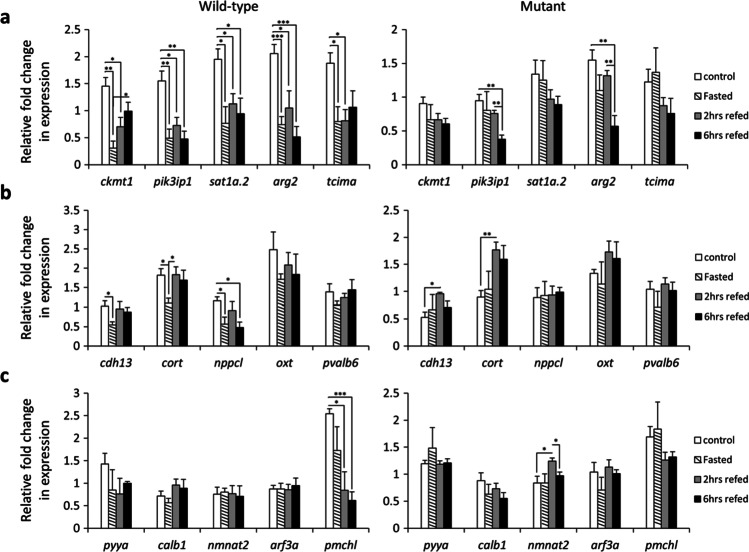
Fig. 1
Expression dynamics of selected co-expressed genes within each genotype during the fasting-refeeding experiment. Expression changes of (
Figure Data
Acknowledgments
This image is the copyrighted work of the attributed author or publisher, and
ZFIN has permission only to display this image to its users.
Additional permissions should be obtained from the applicable author or publisher of the image.
Full text @ Fish Physiol. Biochem.