
- Title
-
Overlapping Requirements for Tet2 and Tet3 in Normal Development and Hematopoietic Stem Cell Emergence
- Authors
- Li, C., Lan, Y., Schwartz-Orbach, L., Korol, E., Tahiliani, M., Evans, T., Goll, M.G.
- Source
- Full text @ Cell Rep.
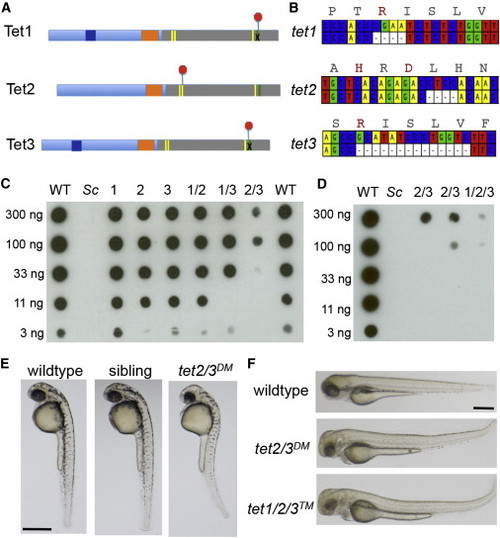
Mutation of Zebrafish tet1, tet2, and tet3 (A) Schematic illustrating early termination caused by TALEN mutations in zebrafish tet1, tet2, and tet3. Red octagons indicate the position of early termination signals. Yellow bars indicate conserved iron binding residues, and the green bar indicates the arginine required for 2-oxoglutarate binding. (B) Schematic depicting deleted bases in zebrafish tet1, tet2 and tet3. Corresponding amino acid sequences for the wild-type allele are included, with residues required for cofactor binding or catalysis indicated in red. (C) Dot blot for 5hmC on genomic DNA isolated from larvae at 5 dpf. Numbers indicate the mutated tet gene(s) in each sample. Sc indicates DNA isolated from Saccharomyces cerevisiae. Horizontal rows depict 3-fold serial dilutions of DNA. (D) Dot blot for 5hmC on genomic DNA isolated from larvae at 5 dpf including DNA isolated from tet1/2/3TM larvae. (E) Lateral views of a representative wild-type larva, a tet2/3DM larva and a sibling larva derived from a tet2mk17/mk17, tet3mk18/+ intercross at 36 hpf. (F) Lateral views of a representative wild-type larva, a tet2/3DM larva and tet1/2/3TM larva at 3 dpf. All scale bars indicate 500 µM. See also Figure S1. PHENOTYPE:
|
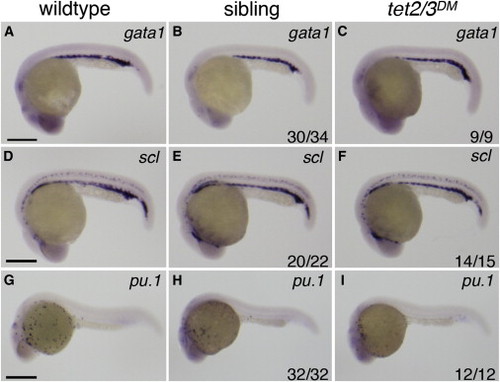
Markers of Primitive Hematopoiesis Are Similarly Expressed in Wild-Type, tet2mk17/mk17, and tet2/3DM Larvae (A–I) Representative lateral views of wild-type larvae compared to tet2/3DM and tet2mk17/mk17 sibling larvae derived from tet2mk17/mk17, tet3mk18/+ intercrosses. (A–C) WISH for the primitive erythroid marker gata1 at 25 hpf. (D–F) WISH for the primitive erythroid marker scl at 25 hpf. (G–I) WISH for the primitive myeloid marker pu.1 at 25 hpf. Numbers in the lower right hand corner indicate the fraction of embryos exhibiting WISH labeling similar to the representative image. Scale bars indicate 500 µM. EXPRESSION / LABELING:
|

tet2 and tet3 Have Overlapping Functions in HSC Development (A and B) WISH for rag1 at 5 dpf. Arrow indicates thymic T cells in wild-type larvae. (C and D) GFP labeled macrophages and neutrophils in 6 dpf larvae carrying the Tg(lysC:GFP) transgene. (E and F) WISH for the HSC marker runx1 in the DA at 36 hpf. (G and H) WISH for the HSC marker c-myb in the DA at 36 hpf. (I) Number of sibling and tet2/3DM embryos with wild-type (+++), reduced (++), or nearly absent (+) runx1 labeling in the DA. Numbers are representative of three independent crosses. (J–M) WISH for runx1 in the DA at 32 hpf. (N) Graph indicating the percent of tet2/3DM larvae exhibiting high runx1 staining in the DA in uninjected controls or following injection with 100 pg mRNA encoding TET2, TET2 H1382Y.D1384A (TET2 mutant), or TET3. Numerical data are presented as the mean ± SEM. Numbers in the lower right corner of images indicate the fraction of larvae with WISH labeling similar to the representative image. All scale bars indicate 100 µM. See also Figure S2. |
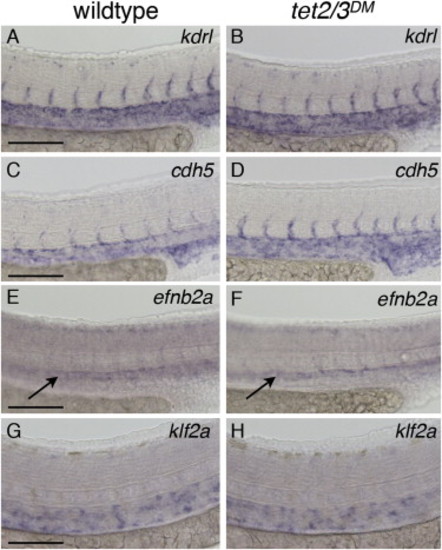
Normal Vasculature and Blood Flow in tet2/3DM Larvae (A and B) WISH for the vascular marker kdrl at 31 hpf. (C and D) WISH for vascular marker cdh5 at 31 hpf. (E and F) WISH for the arterial marker efnb2a at 31 hpf. (G and H) WISH for the blood-flow-dependent marker klf2a at 36 hpf. Scale bars indicate 100 µM. See also Figure S3. |
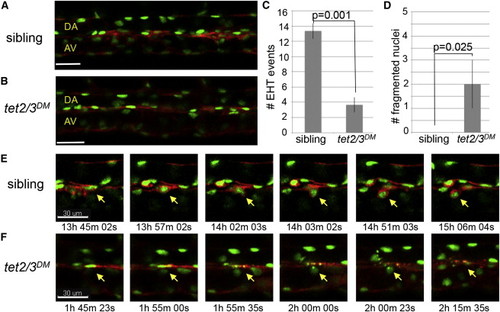
Tet2/3 Are Required for HSC Emergence through the Endothelial to Hematopoietic Transition (A and B) Merged images depicting GFP and mCherry labeling of the vasculature in Tg(kdrl:Ras-mCherry), Tg(kdrl:H2B-EGFP) transgenic larvae at 30 hpf. (C) Number of EHT events detected between 30 and 46 hpf in tet2/3DM larvae and siblings. Numerical data are presented as the mean ± SEM. (D) Number of fragmented nuclei observed in the DA of tet2/3DM larvae and their siblings between 30 and 46 hpf. Numerical data are presented as the mean ± SEM. (E) Sequences from Movie S1 documenting the stepwise emergence of an HSC from the DA of a sibling larva. For each time point, merged GFP and mCherry images are shown. The yellow arrow indicates the cell undergoing EHT. (F) Sequences from Movie S2 documenting a cell undergoing nuclear fragmentation in the DA of a tet2/3DM larva. For each time point, merged GFP and mCherry images are shown. The yellow arrow indicates the cell with nuclear fragmentation. All scale bars indicate 30 µM. See also Movies S1 and S2. |

Tet2/3 Regulate Expression of the gata2b/scl/runx1 Transcriptional Network in the Hemogenic Endothelium (A and B) WISH for scl at 31 hpf. (C and D) WISH for runx1 at 24 hpf. (E and F) WISH for gata2b at 24 hpf. (G and H) WISH for gata2a at 24 hpf. (I and J) WISH for runx1 in the DA of mock-injected and sclβ mRNA-injected tet2/3DM embryos at 36 hpf. (K and L) WISH for runx1 in the DA of mock-injected and gata2b mRNA-injected sibling embryos at 36 hpf. (M) Percent of tet2/3DM embryos with high runx1 expression following mock injection or injection with mRNA encoding Sclβ (50 pg) or Gata2b (200 pg). Numerical data are presented as the mean ± SEM. Numbers in the lower right corner of images indicate the fraction of larvae with WISH labeling similar to the representative image. All scale bars indicate 50 µM. See also Figure S4. |
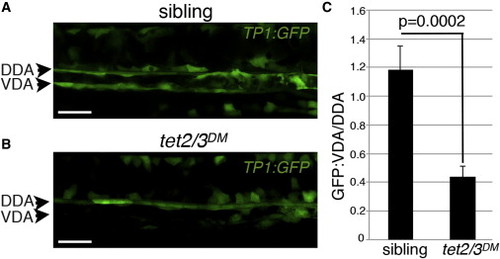
Tet2/3 Are Required for Notch Signaling in the Hemogenic Endothelium (A and B) Confocal images of Tp1:GFP expression in the dorsal aorta of sibling and tet2/3DM larvae at 28 hpf. DDA indicates the dorsal wall of the dorsal aorta. VDA indicates the ventral wall of the dorsal aorta. (C) Ratio of GFP fluorescence intensity in the VDA/DAA in sibling and tet2/3DM larvae (n = 11 per genotype). Numerical data are presented as the mean ± SEM. Scale bars indicate 100 µM. |

Reduced labeling of c-myb positive hematopoietic stem and progenitor cells in tet2/3DM larvae, Related to Figure 3 (A-B) WISH for c-myb at 57 hpf. (C-D) WISH for c-myb at 4 dpf. Arrow indicates the caudal hematopoietic tissue (CHT). (E-F) WISH for c-myb at 5 dpf. Arrow indicates the caudal hematopoietic tissue (CHT). |
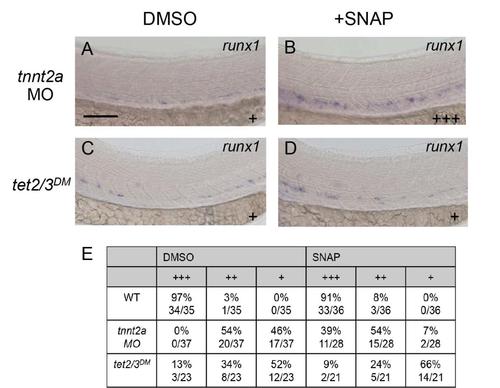
SNAP does not rescue HSC development in tet2/3DM larvae, Related to Figure 4 (A-B) WISH for runx1 in the DA of 36 hpf tnnt2a morpholino-injected embryos following exposure to DMSO or SNAP. (C-D) WISH for runx1 in the DA of 36 hpf tet2/3DM embryos following exposure to DMSO or SNAP. (E) Number of tet2/3DM larvae exhibiting high (+++), low (++) or negligible (+) runx1 expression in the DA at 36 hpf following exposure to DMSO or SNAP. The scale bar represents 50 µm. |
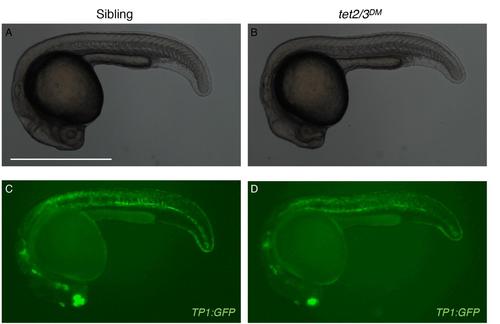
TP1:GFP expression reveals similar overall patterns of Notch signaling in sibling and tet2/3DM larvae, Related to Figure 7 (A-B) Bright-field images of a representative sibling and tet2/3DM larvae at 26 hpf. (C-D) GFP expression in TP1:GFP transgenic larvae at 26hpf. The scale bar represents 500 µm. |