
|
Fig. 3
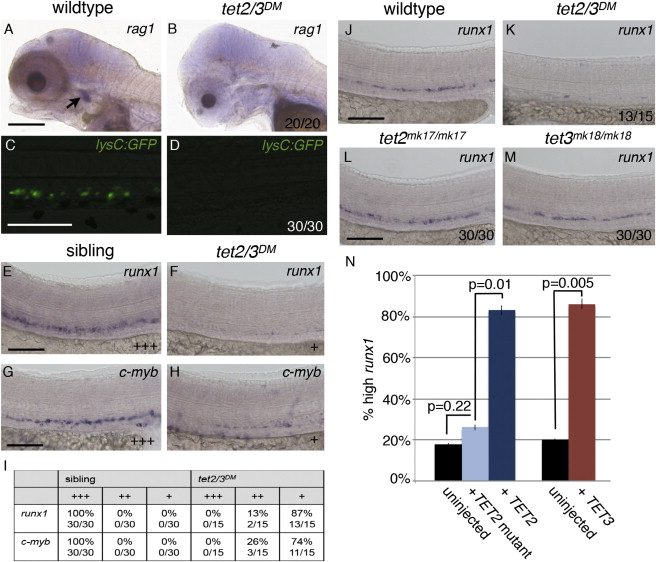
tet2 and tet3 Have Overlapping Functions in HSC Development
(A and B) WISH for rag1 at 5 dpf. Arrow indicates thymic T cells in wild-type larvae.
(C and D) GFP labeled macrophages and neutrophils in 6 dpf larvae carrying the Tg(lysC:GFP) transgene.
(E and F) WISH for the HSC marker runx1 in the DA at 36 hpf.
(G and H) WISH for the HSC marker c-myb in the DA at 36 hpf.
(I) Number of sibling and tet2/3DM embryos with wild-type (+++), reduced (++), or nearly absent (+) runx1 labeling in the DA. Numbers are representative of three independent crosses.
(J–M) WISH for runx1 in the DA at 32 hpf.
(N) Graph indicating the percent of tet2/3DM larvae exhibiting high runx1 staining in the DA in uninjected controls or following injection with 100 pg mRNA encoding TET2, TET2 H1382Y.D1384A (TET2 mutant), or TET3. Numerical data are presented as the mean ± SEM.
Numbers in the lower right corner of images indicate the fraction of larvae with WISH labeling similar to the representative image. All scale bars indicate 100 µM. See also Figure S2.