
- Title
-
Definition of the characteristic neurogenesis pattern in the neural plate by the Hes1 orthologue gene, her6, during early zebrafish development
- Authors
- Tsuruoka, M., Tokizaki, H., Yamasu, K.
- Source
- Full text @ Cells Dev
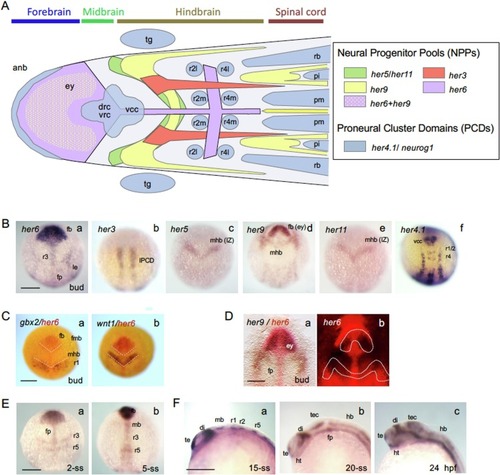
Expression of her6 in the developing brain of zebrafish embryos. A. Summarized view of her expression in the developing brain in zebrafish embryos. Schematic diagram of the anterior neural plate showing distribution of proneural clusters (PCDs) and neural progenitor pools (NPPs), which are marked with various her genes (modified from Stigloher et al., 2008). The expression of her6, revealed in the current study, is shown in purple. In the MHB region, the expression of her3, her5, her11, and her9 is overlapped. her9 expression in the floor plate is omitted to avoid confusion (Latimer et al., 2005). B. Expression patterns of various her genes in bud-stage embryos. C, D. Localization of her6 expression in the forebrain. her6 expression was compared with that of gbx2 in rhombomere 1 (Ca), with that of wnt1 in the posterior midbrain (Cb), or with that of her9 by 2-color WISH (red, her6; blue, gbx2, wnt1, her9) (D). The her6 domain was specifically detected by fluorescence. Da, Db. Flat-mount views showing a bright-field view (Da) and a Fast Red-derived fluorescence view showing her6 expression (Db). White broken lines in C indicate the forebrain-midbrain boundary and midbrain-hindbrain boundary. White broken line in Db encircles the expression of her9. E. Expression of her6 in the brain at early somite stages. A–E. Dorsal views with anterior to the left (A) or to the top (B–E). F. Lateral views with anterior to the left and dorsal to the top. anb, anterior neural boundary; di, diencephalon; drc, dorso-rostral cluster; ey, eye field; fb, forebrain; fmb, forebrain-midbrain boundary; fp, floor plate; hb, hindbrain; ht., hypothalamus; IPCD, inter-proneural cluster domain; IZ, intervening zone; le, lateral ectoderm; mb, midbrain; mhb, midbrain-hindbrain boundary; pi, primary spinal interneurons; pm, primary spinal motor neurons; r1–5, rhombomeres 1–5; r2l/r2m, lateral neurons/motoneurons in rhombomere 1/2; r4l/r4m, lateral neurons/motoneurons in rhombomere 4/4; rb, spinal sensory neurons (Rohon-Beard neurons); te, telencephalon; tec, optic tectum. tg, trigeminal ganglion; vcc, ventro-caudal cluster; vrc, ventro-rostral cluster. Scale bars, 200 μm (B, C, E, F) or 100 μm (D). EXPRESSION / LABELING:
|
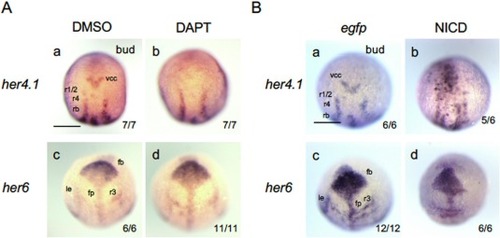
Dependency of her gene expression on Notch signaling in the neural plate. A. Effects of Notch signaling inhibitor on her expression. Embryos were incubated with 100 μM DAPT or DMSO from the shield stage (6 hpf) to the bud stage (10 hpf) and subjected to WISH analysis. B. Effects of NICD-mediated Notch activation on her expression. Fertilized eggs were microinjected with pCS2+NICD-HT (NICD) or pCS2+ egfp (egfp) (10 pg/embryo) together with egfp mRNA (50 pg/embryo). Morphologically normal embryos with EGFP fluorescence were subjected to WISH at the bud stage. The expression of her4.1 (top row) or her6 (bottom row) are shown. Dorsal views with anterior to the top. Numbers of embryos showing the indicated phenotype and total numbers of scored embryos are shown in the bottom right. The experiment was repeated three times for both DAPT treatment and NICD overexpression, yielding essentially identical results. See the legend to Fig. 1 for abbreviations. Scale bar, 200 μm. |
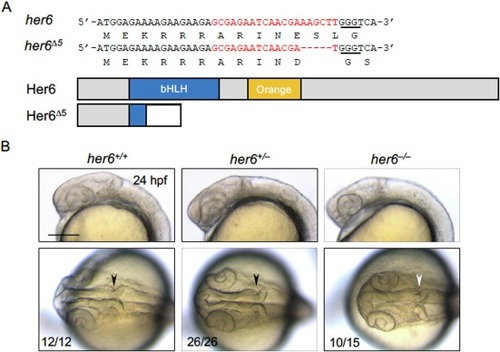
Establishment of her6 mutant lines by genome editing. A. Mutation introduced into the her6 gene by genome editing. Indels were introduced into the bHLH domains by the CRISPR/Cas9 method. The target base sequence (red) and corresponding amino acid sequence are shown above the schematic diagram of the gene product. PAM sequences are underlined. Wild-type and nonsense coding sequences due to frameshifts are shown with gray and white boxes, except for bHLH domains and Orange domains that are shown with blue and orange boxes, respectively. In the mutant line obtained, a frameshift occurred in the N-terminal portion of the bHLH domain due to a 5-bp deletion. B. Morphology of the heads of her6 mutants at 24 hpf. The heads of live embryos obtained by heterozygotic cross (her6+/Δ5) were photographed and then genotyped. Upper row, lateral views with anterior to the left and dorsal to the top. Lower row, dorsal views with anterior to the left. Isthmus regions are shown with arrowheads. Homozygotes alone showed deformed (asymmetric) isthmus (white arrowheads). Numbers of the embryos with the indicated morphology and total scored embryos are shown in the bottom left. Scale bar, 200 μm. PHENOTYPE:
|
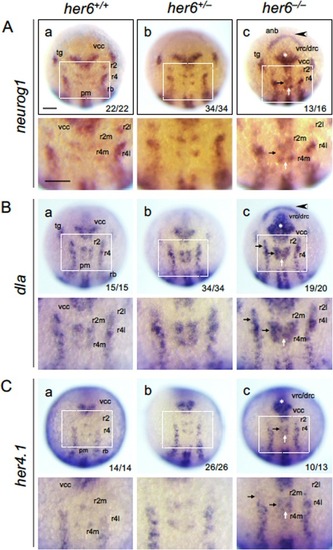
Ectopic expression of proneural cluster-related genes in her6 mutants. Offspring of heterozygotic crosses were stained by WISH at the bud stage (neurog1, dla, her4.1), photographed, and then genotypes. Dorsal views are shown with anterior to the top. The expression patterns in whole embryos (top) and hindbrain regions boxed above (bottom) are shown for respective genes and genotypes. Arrowheads indicate enhanced expression in the anterior-most portion of the neural plate (anb). Arrows (black and white) mark ectopic expression in r3 (m-IPCD-r3, l-IPCD-r3) and midline (md-IPCD-r3/5), respectively. Asterisks (*) indicate ectopic expression around drc and vrc and enhanced expression in vcc. Numbers of the embryos with the indicated expression patterns and total scored embryos are shown in the bottom-right. See the legend to Fig. 1 for abbreviations. Scale bars, 100 μm. |
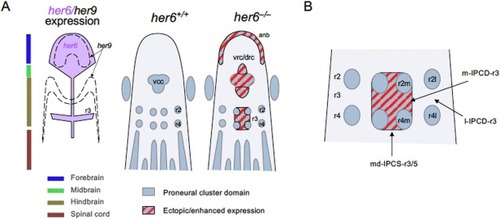
Abnormal neurogenesis in the anterior neural plate in her6 mutants. Schematic views for the anterior neural plate (A) and the enlarged view of the central hindbrain (B), showing abnormal expression of proneural cluster domain (PCD) genes in her6 mutants (cf. Fig. 4). Dorsal views with anterior to the top. (Left) Purple indicates her6 expression, while black dashed lines indicate the extent of her9 expression. (Middle and right) Expression patterns of PCD genes in wild-type (middle) and in her6 homozygotes (right). PCD gene expression was ectopically activated or enhanced in ANB, vrc/drc/vcc, r3 (IPCD-r3), and midline of the r1/2– r4 region (md-IPCS-r3/5). In the IPCD-r3, ectopic expression is often seen in its medial portion (medial IPCD-r3, m-IPCD-r3), whereas rarely in its lateral portion (lateral IPCD, l-IPCDS-r3). See the legend to Fig. 1 for abbreviations. |
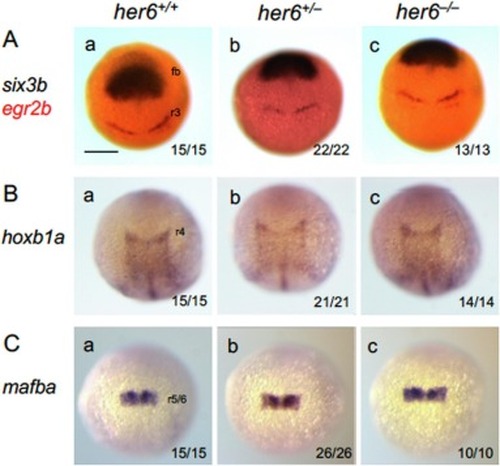
Expression of brain regionalization genes in her6 mutants. Expression patterns of brain regionalization genes (A. six3b in the forebrain and egr2b in the r3 and r5; B. hoxb1a in the r4 and posterior neural plate; C. mafba in the r5 and r6) were assessed at the bud stage in wild-type (+/+), heterozygotes (+/−), and homozygotes (−/−) in terms of her6 mutation. At the bud stage, egr2b had just started to be expressed faintly in r3 alone. Dorsal views with anterior to the top. Numbers of the embryos with the indicated patterns and total scored embryos are shown in the bottom-right. See the legend to Fig. 1 for abbreviations. Scale bar, 200 μm. EXPRESSION / LABELING:
|

Unillustrated author statements PHENOTYPE:
|