
Fig. 1
- ID
- ZDB-IMAGE-250710-17
- Genes
- Publication
- Tsuruoka et al., 2025 - Definition of the characteristic neurogenesis pattern in the neural plate by the Hes1 orthologue gene, her6, during early zebrafish development
- All Figures
- Figures for Tsuruoka et al., 2025
|
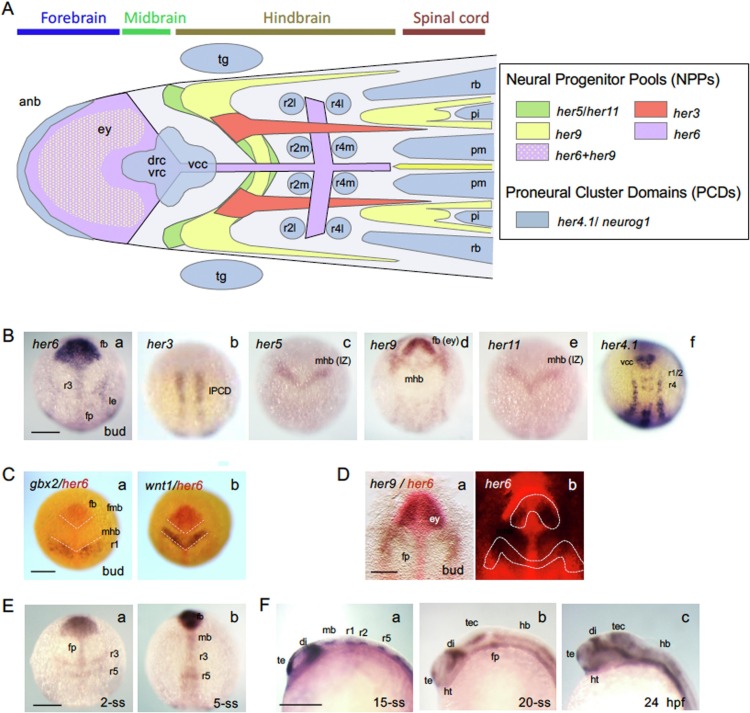
Fig. 1 Expression of her6 in the developing brain of zebrafish embryos. A. Summarized view of her expression in the developing brain in zebrafish embryos. Schematic diagram of the anterior neural plate showing distribution of proneural clusters (PCDs) and neural progenitor pools (NPPs), which are marked with various her genes (modified from Stigloher et al., 2008). The expression of her6, revealed in the current study, is shown in purple. In the MHB region, the expression of her3, her5, her11, and her9 is overlapped. her9 expression in the floor plate is omitted to avoid confusion (Latimer et al., 2005). B. Expression patterns of various her genes in bud-stage embryos. C, D. Localization of her6 expression in the forebrain. her6 expression was compared with that of gbx2 in rhombomere 1 (Ca), with that of wnt1 in the posterior midbrain (Cb), or with that of her9 by 2-color WISH (red, her6; blue, gbx2, wnt1, her9) (D). The her6 domain was specifically detected by fluorescence. Da, Db. Flat-mount views showing a bright-field view (Da) and a Fast Red-derived fluorescence view showing her6 expression (Db). White broken lines in C indicate the forebrain-midbrain boundary and midbrain-hindbrain boundary. White broken line in Db encircles the expression of her9. E. Expression of her6 in the brain at early somite stages. A–E. Dorsal views with anterior to the left (A) or to the top (B–E). F. Lateral views with anterior to the left and dorsal to the top. anb, anterior neural boundary; di, diencephalon; drc, dorso-rostral cluster; ey, eye field; fb, forebrain; fmb, forebrain-midbrain boundary; fp, floor plate; hb, hindbrain; ht., hypothalamus; IPCD, inter-proneural cluster domain; IZ, intervening zone; le, lateral ectoderm; mb, midbrain; mhb, midbrain-hindbrain boundary; pi, primary spinal interneurons; pm, primary spinal motor neurons; r1–5, rhombomeres 1–5; r2l/r2m, lateral neurons/motoneurons in rhombomere 1/2; r4l/r4m, lateral neurons/motoneurons in rhombomere 4/4; rb, spinal sensory neurons (Rohon-Beard neurons); te, telencephalon; tec, optic tectum. tg, trigeminal ganglion; vcc, ventro-caudal cluster; vrc, ventro-rostral cluster. Scale bars, 200 μm (B, C, E, F) or 100 μm (D).