
- Title
-
Modeling sacsin depletion in Danio Rerio offers new insight on retinal defects in ARSACS
- Authors
- Naef, V., Damiani, D., Licitra, R., Marchese, M., Vecchia, S.D., Baggiani, M., Brogi, L., Galatolo, D., Landi, S., Santorelli, F.M.
- Source
- Full text @ Neurobiol. Dis.
Loss of EXPRESSION / LABELING:
PHENOTYPE:
|
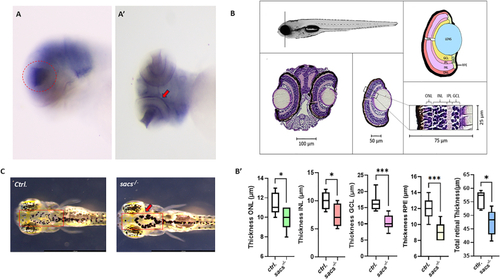
Visual impairment in the PHENOTYPE:
|
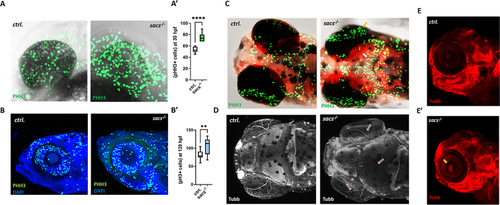
Zebrafish mutants lacking the |
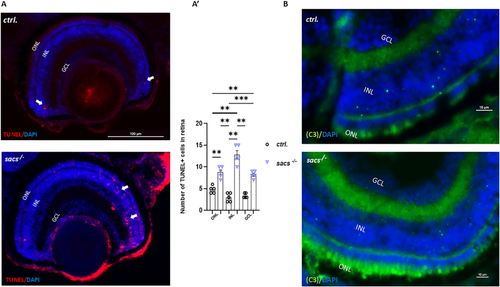
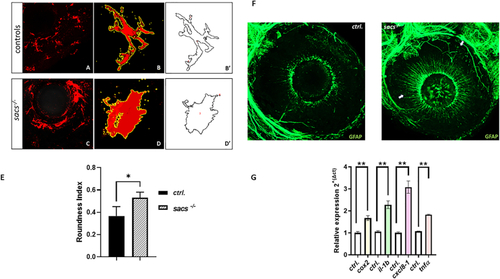
Increased apoptosis contributes to retinal defects in |
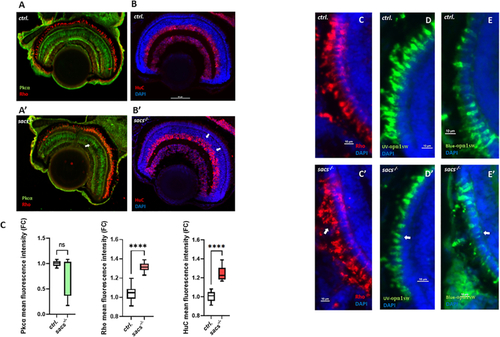
Sacsin deficiency alters cell fate and photoreceptor structure in zebrafish retina (A) Representative confocal images of the retina of |
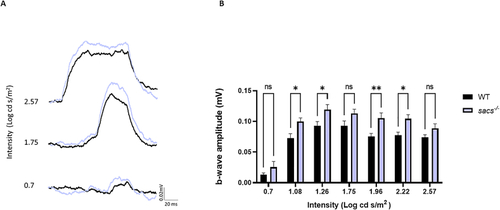
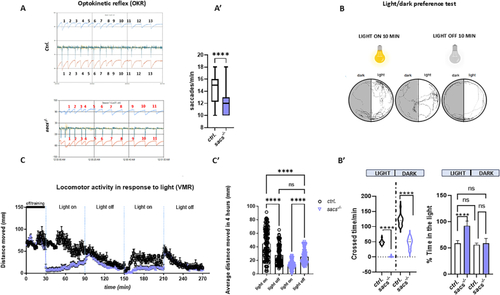
ERG response is increased in PHENOTYPE:
|
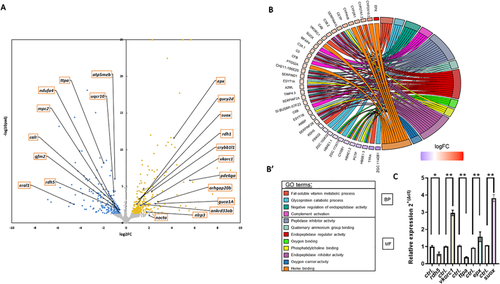
RNA-seq analysis revealed mitochondrial pathway changes and fat-soluble vitamin deficiency. (A) Significant genes with padj<0.05 and log2FC > 0.58 or log2FC < −0.58 are highlighted in yellow or blue, respectively. Genes not significantly expressed are represented by grey points. (B) The top enriched Biological Processes GO categories have then been plotted. Loss of sacsin during early development leads to an impairment in fat-soluble vitamin related protein (e.g TTPA) and other proteins involved in mitochondrial function and metabolism. Relative mRNA expression of DEGs genes were evaluated in |
|
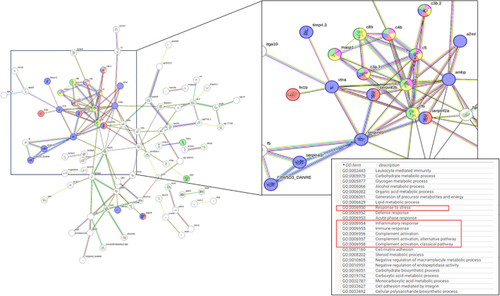
Protein-Protein Interaction Analysis. Using bioinformatic suite STRING ( |
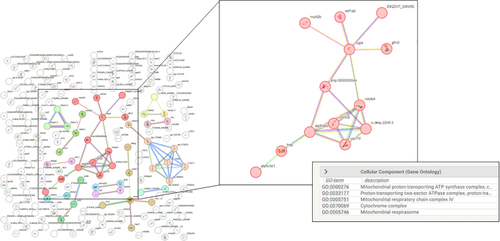
Protein-Protein Interaction Analysis. Using bioinformatic suite STRING ( |