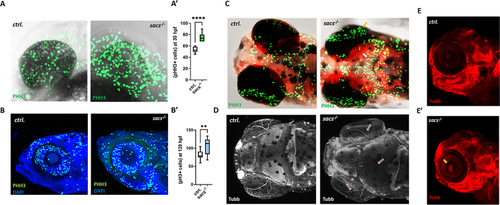
Zebrafish mutants lacking the sacs gene exhibited an imbalance between cell proliferation and differentiation. (A-B). Representative figure of anti-pH 3 immunostaining. A-A') Lateral view pictures of control and sacs-/- specimens. At 24 hpf homozygous larvae showed a significant increase in pH 3-positive cells that were counted in the whole eye area. **** p < 0.0001 was calculated by the two-tailed Mann-Whitney U Test. Error bars indicate mean ± s.e.m. (B-B′) Anti-pH 3 immunostaining at 120 hpf in controls and sacs-/- mutant larvae. **p < 0.01, Statistics were calculated by two-tailed Mann-Whitney U Test. (C) Representative fluorescence images of anti-pH 3 immunostaining at 120 hpf (dorsal view) in controls and sacs-/- mutant larvae. (D) Immunostaining of acetylated-α tubulin. Dorsal view pictures of representative control and sacs-/-specimens. Red arrows indicate defects in axonal outgrowth. (E) Representative immunostaining of acetylated-α tubulin at 120 hpf (lateral view). sacs-/-mutants exhibited alteration in optic nerve thickness (yellow arrow). All images were acquired using a Zeiss LSM 900 confocal-microscope. PHH3+ cells were counted per area. Scale bar = 50 μm (A) and 10 μm (B). (For interpretation of the references to colour in this figure legend, the reader is referred to the web version of this article.)
|
