FIGURE

Fig. 6

ID
ZDB-FIG-250203-35
Publication
Naef et al., 2025 - Modeling sacsin depletion in Danio Rerio offers new insight on retinal defects in ARSACS
Other Figures
All Figure Page
Back to All Figure Page
Fig. 6

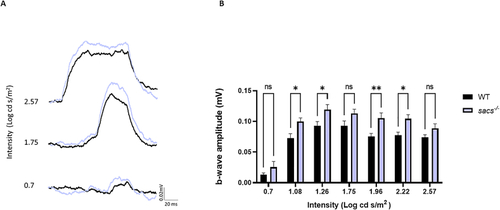
ERG response is increased in sacs-/- larvae. (A) Representative ERG traces at low, medium and maximum light intensity from control (black), sacs-/- (blue) at 120 hpf. (B) Averaged ERG b-wave amplitudes from control (black), sacs-/- (blue) larvae. Sacs-/- mutants produce an increase of the ERG b-wave amplitude compared with control throughout all light intensities tested (*p < 0.05, **p < 0.01). Data were collected from three independent experiments (N = 30 for each group, sacs-/- and controls). For statistical comparison, a two-way ANOVA test was used. (ns: not significant; SI unit for luminance is candela per square meter (cd/m2)). (For interpretation of the references to colour in this figure legend, the reader is referred to the web version of this article.)

Expression Data

Expression Detail
Antibody Labeling
Phenotype Data

Phenotype Detail
Acknowledgments
This image is the copyrighted work of the attributed author or publisher, and ZFIN has permission only to display this image to its users. Additional permissions should be obtained from the applicable author or publisher of the image. Full text @ Neurobiol. Dis.