
Fig. 8
- ID
- ZDB-IMAGE-250203-38
- Genes
- Antibodies
- Publication
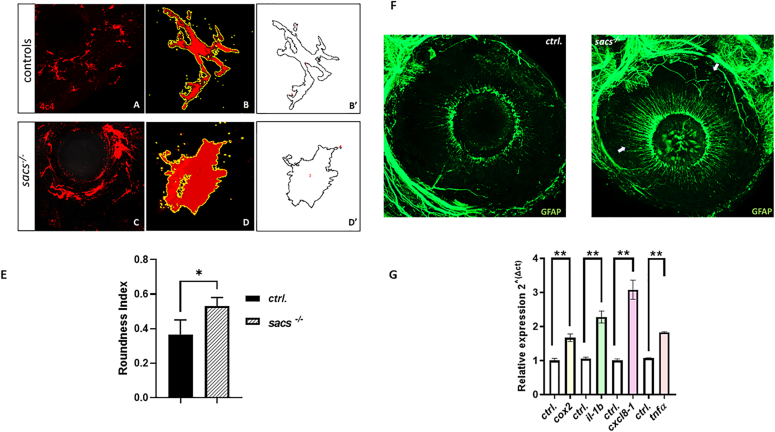
- Naef et al., 2025 - Modeling sacsin depletion in Danio Rerio offers new insight on retinal defects in ARSACS
- All Figures
- Figures for Naef et al., 2025
|
Fig. 8