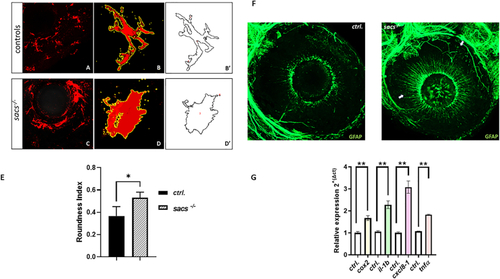
sacs-/- mutant retinas showed Müller glia activation and inflammation (A and C) Eye confocal images of control and sacs-/- larvae obtained after immunostaining with antibody 4C4, which is specific for zebrafish microglia. (B and D) cell digital image. After random selection of cells from the eye picture (A and C), the noise was removed by filtering the overall background to get a shape extraction. Next, the image was changed to grayscale, and then transformed into a binary image. The binary image was edited to clear the background and to join all branches (B′ and D′). (E) Quantification of the roundness index revealed activated microglia in sacs-/- larvae which appeared ameboid in shape. *p < 0.05 was calculated by two-tailed Mann-Whitney U Test (N = 3 for each group). (F) The up-regulation of GFAP in sacs-/- retinas as detected by immunostaining. (G) Relative mRNA expression of inflammatory factors evaluated in sacs-/- larvae at 120 hpf. qRT-PCR analysis revealed an increase in the levels of inflammatory genes, normalized to β-actin. Three independent RNA samples from sacs-/- mutant larvae at 120 hpf and from controls. *p < 0.05, calculated by two-tailed Student's t-test. Error bars indicate mean ± s.e.m.
|
