
- Title
-
Ypel5 regulates liver development and function in zebrafish
- Authors
- Deng, Y., Han, X., Chen, H., Zhao, C., Chen, Y., Zhou, J., de The, H., Zhu, J., Yuan, H.
- Source
- Full text @ J. Mol. Cell Biol.
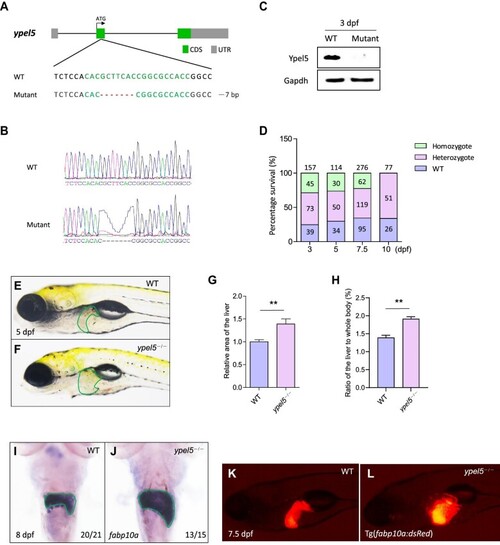
Disruption of the EXPRESSION / LABELING:
PHENOTYPE:
|
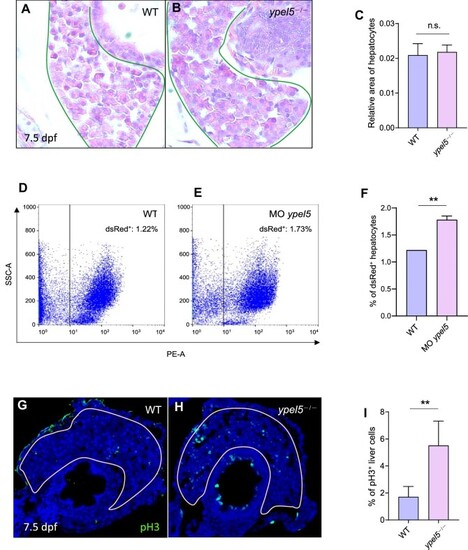
PHENOTYPE:
|
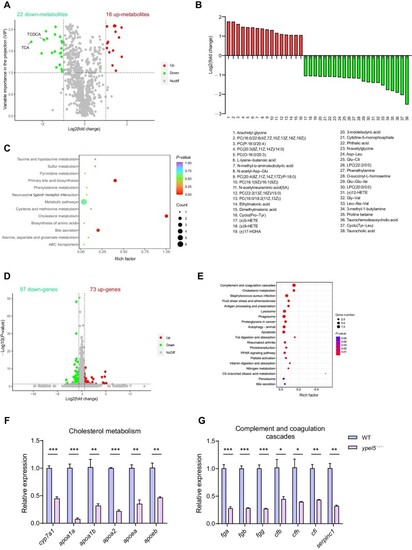
EXPRESSION / LABELING:
PHENOTYPE:
|
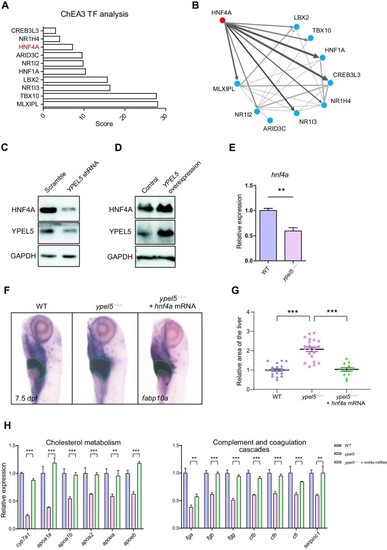
Hnf4a acts as a crucial downstream effector of Ypel5. ( EXPRESSION / LABELING:
PHENOTYPE:
|
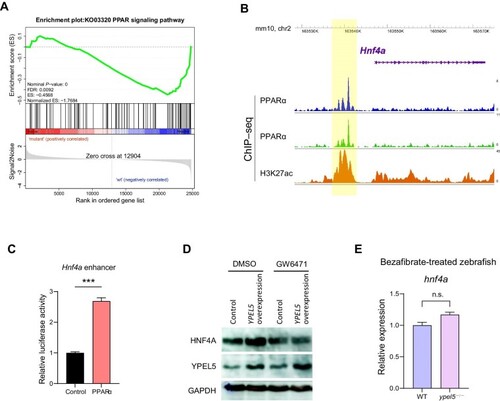
PPARα signaling mediates the regulation of EXPRESSION / LABELING:
PHENOTYPE:
|