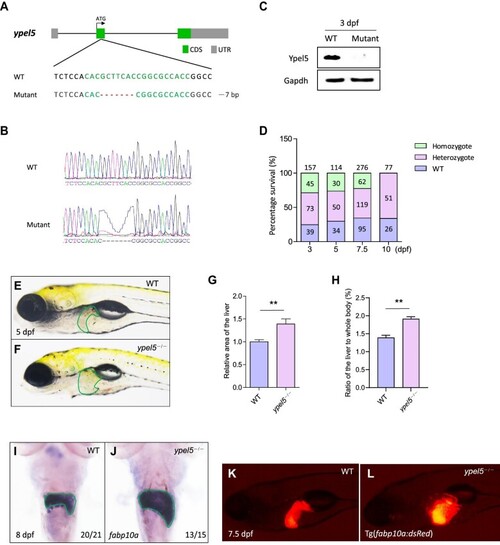
Disruption of the ypel5 gene causes liver enlargement. (A) Genetic inactivation of zebrafish ypel5 gene based on CRISPR/Cas9. Schematic representation of CRISPR/Cas9 target site at exon 2 as used in this study. The gRNA target site is highlighted in green, and the indel is indicated by a red dash. (B) Genotyping of the ypel5−/− mutant by Sanger sequencing. (C) Western blot analysis of Ypel5 using lysates from wild-type (WT) and ypel5−/− mutant embryos at 3 dpf. Gapdh was used as the loading control. (D) The survival of zebrafish larvae at different developmental stages. No homozygotes were identified at 10 dpf. (E–H) Brightfield images (E and F), relative liver size (G), and the ratio of the liver to whole body (H) of WT and ypel5−/− mutant zebrafish at 5 dpf. The livers are outlined with green lines. Data shown are mean ± SEM. Student's t-test. **P < 0.01. (I and J) WISH assay of fabp10a at 8 dpf. Green lines circle the boundary of the liver. The ratio of embryos with the representative expression pattern is indicated at the right bottom. (K and L) Representative images of WT and ypel5−/−/Tg(fabp10a:dsRed) zabrafish at 7.5 dpf. The liver was marked by red fluorescence.
|
