
Figure 1
- ID
- ZDB-IMAGE-231023-4
- Genes
- Publication
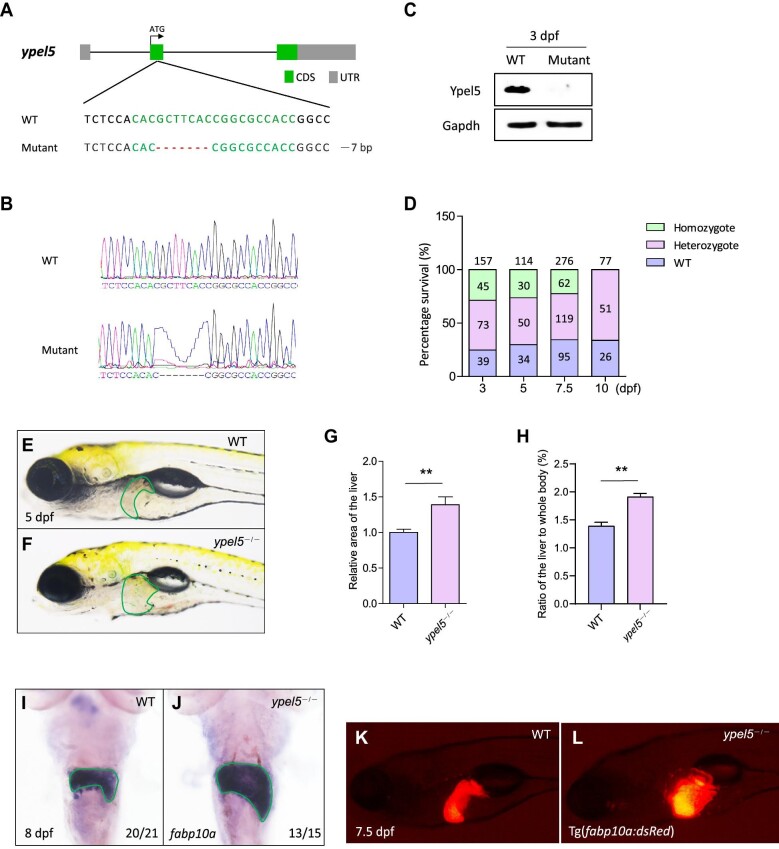
- Deng et al., 2023 - Ypel5 regulates liver development and function in zebrafish
- All Figures
- Figures for Deng et al., 2023
|
Figure 1
Disruption of the