
- Title
-
Pax3 loss of function delays tumour progression in kRAS-induced zebrafish rhabdomyosarcoma models
- Authors
- Kahsay, A., Rodriguez-Marquez, E., López-Pérez, A., Hörnblad, A., von Hofsten, J.
- Source
- Full text @ Sci. Rep.
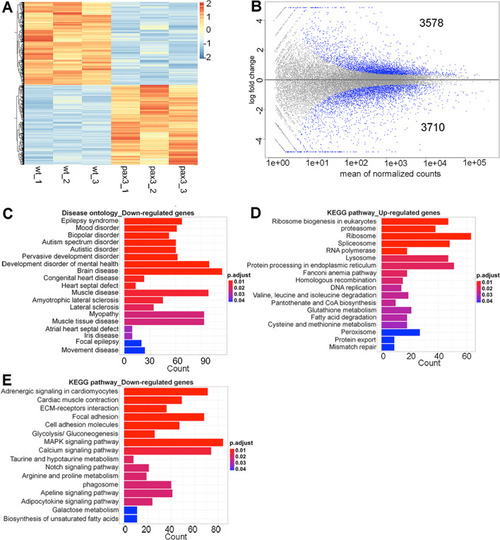
Clustering and pathway analysis of differentially expressed genes (DEGs). (A) Heatmap of significant DEGs between wild type and pax3a−/−;pax3b−/− zebrafish embryos. Regularized log transformed (rlog) count matrix was generated using DESeq2 package. Significant DEGs were used to plot the heatmap of rlog counts. Red and blue represent up- and down-regulated genes, respectively. (B) Scatter plot for DEGs in wild type and pax3a−/−;pax3b−/− showing mean of normalized counts and log2 fold change. All differentially expressed genes (in blue) with adjusted p-value < 0.01. (C) Disease ontology analysis of down-regulated genes. (D,E) KEGG pathway analysis of up- and down-regulated genes. Bar plots represents the number of DEGs involved in each condition. Adjusted p-value was represented by colour scale, and the statistically significance level decreased from red (highly significant) to blue (relatively lower significant). p-value < 0.01. PHENOTYPE:
|

Expression of RAS/MAPK signalling pathway linked genes in wildtype (wt) and |
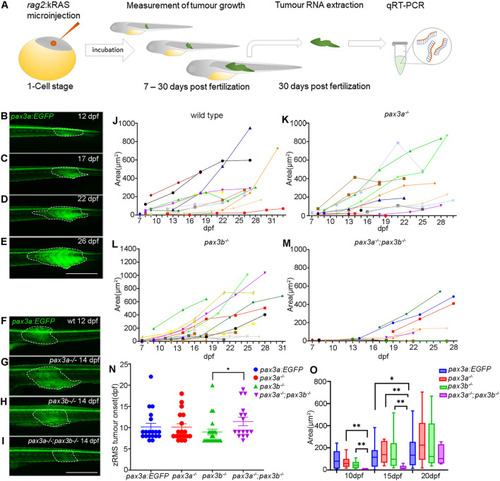
Functional analysis of zRMS progression in wild type and pax3 mutant zebrafish: (A) schematic illustration of generating zRMS, showing microinjection of rag2:kRASG12D into one cell stage zebrafish embryo, zRMS detection and monitoring of tumour growth from 7 to 30 dpf, tumour tissue excision and total RNA extraction at 30 dpf for gene expression analysis using qRT-PCR. (B–E) zRMS identified in pax3a:EGFP zebrafish transgenic line at 12 dpf, 17 dpf, 22 dpf, and 27 dpf. High intensity of GFP expression is observed at the tail area of the zebrafish larvae. Representative image of zRMS tumour progression (F) wild type at 12 dpf, (G) pax3a−/− at 14 dpf, (H) pax3b−/− at 14 dpf and (I) pax3a−/−;pax3b−/− at 14 dpf. Tumour area (μm2) of individual zRMS (J) wild type fish (n = 24), (K) pax3a−/− (n = 18), (L) pax3b−/− (n = 22), (M) pax3a−/−;pax3b−/− (n = 12). (N) zRMS tumour onset is indicated in days post fertilization in wild type fish (n = 20), pax3a−/− (n = 18), pax3b−/− (n = 22) and pax3a−/−;pax3b−/− (n = 16) zebrafish lines. (O) Tumour area (μm2) in zebrafish larvae that were injected with rag2-KRASG12D in wild type (n = 12), pax3a−/− (n = 10), pax3b−/− (n = 16) and pax3a−/−;pax3b−/− (n = 6) zebrafish lines at 10 dpf, 15 dpf and 20 dpf. All experiments were conducted in pax3a:EGFP background. Tumour areas are indicated with dashed lines. Error bars represent mean ± SEM and significance was calculated using Student t-test and Mann Whitney U test where p < 0.05 was considered significant, *p < 0.05, **p < 0.01, ***p < 0.001. Scale bar: 1 mm. PHENOTYPE:
|
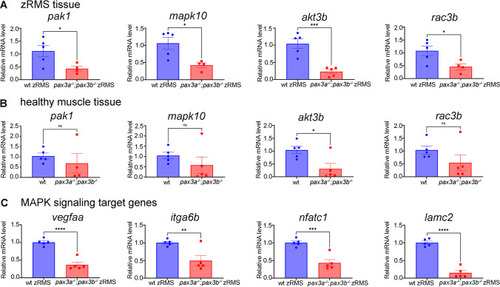
Semi-quantitative RT-PCR for genes linked to RAS/MAPK signalling pathways: (A) Relative mRNA expression of pak1 (n = 4 pax3a−/−;pax3b−/− zRMS) , mapk10, akt3b and rac3b in pax3a−/−;pax3b−/−;pax3a:EGFP zRMS compared with wild type (pax3a:EGFP) zRMS tissue from the similar age. (B) Relative mRNA expression of pak1(n = 4 pax3a−/−;pax3b−/− ), mapk10, akt3b and rac3b in pax3a−/−;pax3b−/−;pax3a:EGFP compared with wild type healthy muscle tissue from the similar age group. (C) Relative mRNA expression of vegfaa, itga6b, nfatc1 and lamc2 in pax3a−/−;pax3b−/−;pax3a:EGFP zRMS compared with wild type (pax3a:EGFP) zRMS tissue. n = 5 in all samples unless otherwise stated. Error bars indicate mean ± SEM and significance was calculated using student t-test where p < 0.05 was considered significant, *p < 0.05, **p < 0.01, ***p < 0.001, ****p < 0.0001. |