
Figure 4
- ID
- ZDB-IMAGE-221018-78
- Genes
- Publication
- Kahsay et al., 2022 - Pax3 loss of function delays tumour progression in kRAS-induced zebrafish rhabdomyosarcoma models
- All Figures
- Figures for Kahsay et al., 2022
|
Figure 4
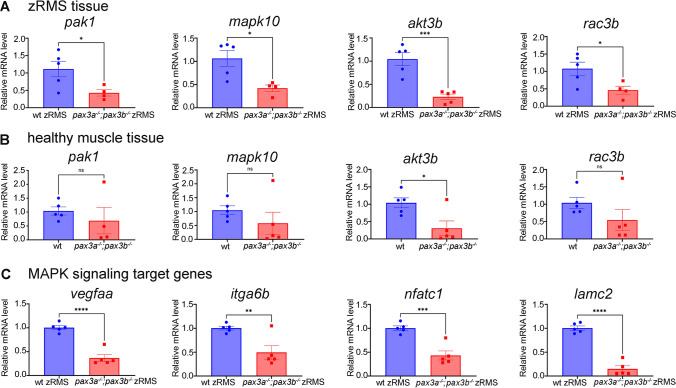
Semi-quantitative RT-PCR for genes linked to RAS/MAPK signalling pathways: (A) Relative mRNA expression of pak1 (n = 4 pax3a−/−;pax3b−/− zRMS) , mapk10, akt3b and rac3b in pax3a−/−;pax3b−/−;pax3a:EGFP zRMS compared with wild type (pax3a:EGFP) zRMS tissue from the similar age. (B) Relative mRNA expression of pak1(n = 4 pax3a−/−;pax3b−/− ), mapk10, akt3b and rac3b in pax3a−/−;pax3b−/−;pax3a:EGFP compared with wild type healthy muscle tissue from the similar age group. (C) Relative mRNA expression of vegfaa, itga6b, nfatc1 and lamc2 in pax3a−/−;pax3b−/−;pax3a:EGFP zRMS compared with wild type (pax3a:EGFP) zRMS tissue. n = 5 in all samples unless otherwise stated. Error bars indicate mean ± SEM and significance was calculated using student t-test where p < 0.05 was considered significant, *p < 0.05, **p < 0.01, ***p < 0.001, ****p < 0.0001.