
Figure 1
- ID
- ZDB-FIG-221018-80
- Publication
- Kahsay et al., 2022 - Pax3 loss of function delays tumour progression in kRAS-induced zebrafish rhabdomyosarcoma models
- Other Figures
- All Figure Page
- Back to All Figure Page
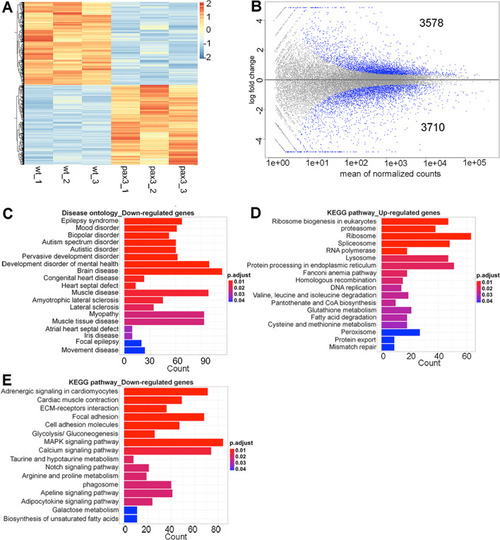
Clustering and pathway analysis of differentially expressed genes (DEGs). (A) Heatmap of significant DEGs between wild type and pax3a−/−;pax3b−/− zebrafish embryos. Regularized log transformed (rlog) count matrix was generated using DESeq2 package. Significant DEGs were used to plot the heatmap of rlog counts. Red and blue represent up- and down-regulated genes, respectively. (B) Scatter plot for DEGs in wild type and pax3a−/−;pax3b−/− showing mean of normalized counts and log2 fold change. All differentially expressed genes (in blue) with adjusted p-value < 0.01. (C) Disease ontology analysis of down-regulated genes. (D,E) KEGG pathway analysis of up- and down-regulated genes. Bar plots represents the number of DEGs involved in each condition. Adjusted p-value was represented by colour scale, and the statistically significance level decreased from red (highly significant) to blue (relatively lower significant). p-value < 0.01. |
| Fish: | |
|---|---|
| Observed In: | |
| Stage: | High-pec |