
- Title
-
Appetite regulating genes in zebrafish gut; a gene expression study
- Authors
- Ahi, E.P., Brunel, M., Tsakoumis, E., Chen, J., Schmitz, M.
- Source
- Full text @ PLoS One
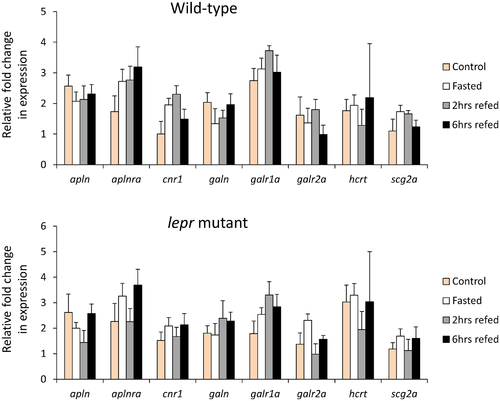
Fig 1. Expression dynamics of orexigenic genes in the gut of wild-type and lepr mutant zebrafish. Means and standard errors of fold changes in expression of five biological replicates are shown for each experimental group. No significant differences between the experimental groups were detected in both genotypes. EXPRESSION / LABELING:
|
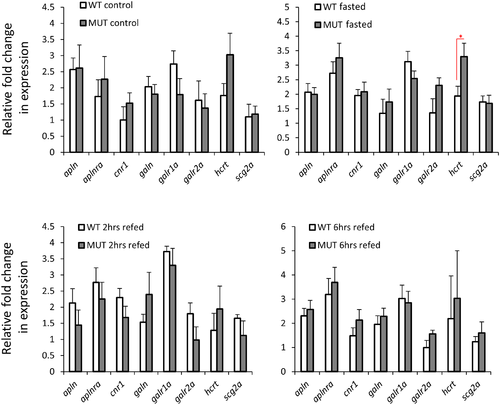
Fig 2. Expression differences of orexigenic genes in the gut of wild-type versus lepr mutant zebrafish in each feeding group. Means and standard errors of fold changes in expression of five biological replicates are shown for each experimental group. Significant differences between the lepr mutant and wild-type are delineated by asterisks (* P < 0.05). |
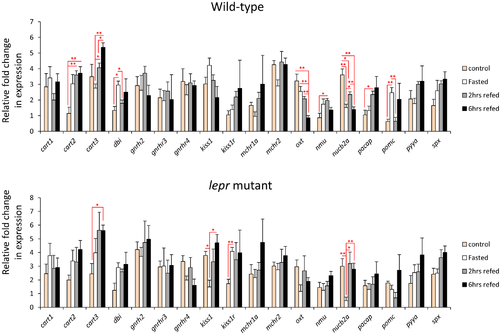
Fig 3. Expression dynamics of anorexigenic genes in the gut of wild-type and lepr mutant zebrafish. Means and standard errors of fold changes in expression of five biological replicates are shown for each experimental group. Significant differences between the experimental groups in each genotype are delineated by asterisks (* P < 0.05; ** P < 0.01). |
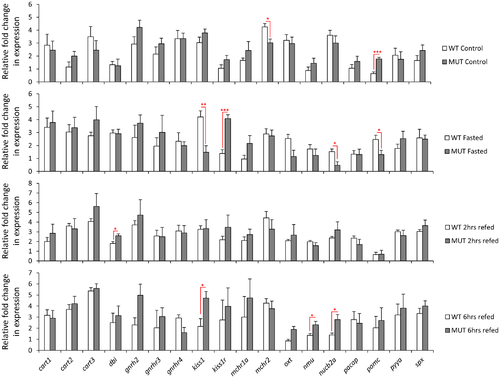
Fig 4. Expression differences of anorexigenic genes in the gut of wild-type versus lepr mutant zebrafish in each feeding group. Means and standard errors of fold changes in expression of five biological replicates are shown for each experimental group. Significant differences between the lepr mutant and wild-type are delineated by asterisks (* P < 0.05; ** P < 0.01; *** P < 0.001). |

Fig 5. Expression dynamics of known gut-expressed genes in the gut of wild-type and lepr mutant zebrafish. Means and standard errors of fold changes in expression of five biological replicates are shown for each experimental group. Significant differences between the experimental groups in each genotype are delineated by asterisks (* P < 0.05; ** P < 0.01; *** P < 0.001). |
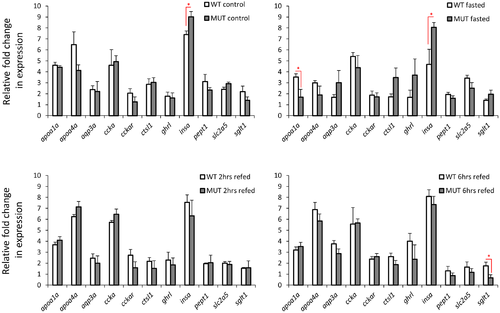
Fig 6. Expression differences of known marker genes in the gut of wild-type versus lepr mutant zebrafish in each feeding group. Means and standard errors of fold changes in expression of five biological replicates are shown for each experimental group. Significant differences between the lepr mutant and wild-type are delineated by asterisks (* P < 0.05). |
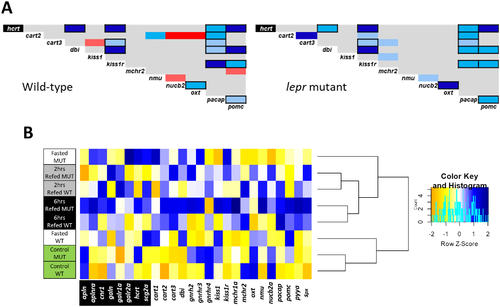
Fig 7. Connectedness of appetite-regulating genes and the feeding conditions based on the gene expression patterns. (A) Pairwise expression correlations of appetite regulating genes in the gut of wild-type and lepr mutant zebrafish. The blue and red colours respectively indicate positive and negative Pearson correlation coefficients and their light to dark shadings show significant levels of P < 0.05, P < 0.01 and P < 0.001, respectively. The gene specified with black background is an orexigenic gene whereas the rest are anorexigenic genes. Pairwise correlations delineated with black borders are similar between the two genotypes. (B) Clustering of the experimental conditions in each genotype based on similarities in expression patterns of the appetite regulating genes (the blue and yellow colors indicate higher and lower expression level, respectively). |