
- Title
-
The Ribosome Biogenesis Factor Ltv1 Is Essential for Digestive Organ Development and Definitive Hematopoiesis in Zebrafish
- Authors
- Zhang, C., Huang, R., Ma, X., Chen, J., Han, X., Li, L., Luo, L., Ruan, H., Huang, H.
- Source
- Full text @ Front Cell Dev Biol
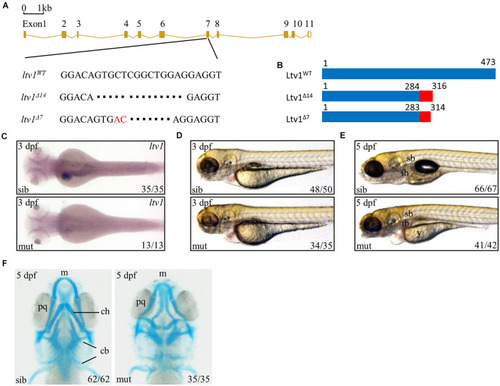
Figure 1. Knockout of ltv1 and craniofacial defects in ltv1Δ14/Δ14 mutant. (A) The sequences flanking the deletion site in ltv1 mutants (ltv1Δ7,14) are shown. The deleted nucleotides are denoted by dashes. In ltv1Δ7/Δ7 mutant, 9 bp nucleotides are deleted and 2 bp nucleotides (red font) are inserted. (B) Two ltv1 mutant alleles (ltv1Δ14 and ltv1Δ7) harbor frameshift mutations that are predicted to give rise to truncated Ltv1 proteins as shown. (C) WISH using ltv1 antisense RNA probe at 3 dpf. (D,E) Representative images of ltv1Δ14/Δ14 mutants and siblings at 3 and 5 dpf. (F) Alcian blue-labeled craniofacial cartilage in ventral view at 5 dpf. Abbreviations used: sb, swimming bladder; ib, intestinal bulb; y, yolk; m, Meckel’s; pq, palatoquadrate; ch, ceratohyal; cb, ceratobranchial. EXPRESSION / LABELING:
PHENOTYPE:
|
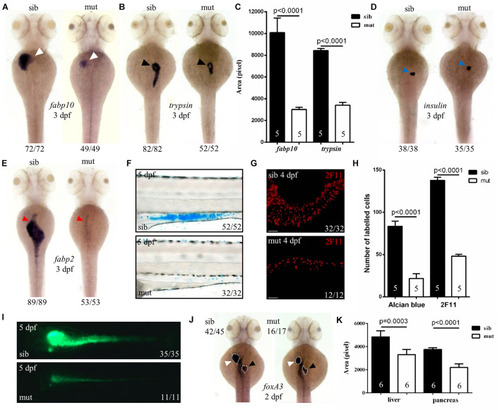
Figure 2. Defects in the development of digestive organs in ltv1Δ14/Δ14 mutant. (A,B,D,E) WISH using the hepatocyte marker fabp10, acinar cell marker trypsin, beta cell marker insulin, and enterocyte marker fabp2 at 3 dpf. (C) Quantification of fabp10 (siblings, N = 5; mutants, N = 5) or trypsin (siblings, N = 5; mutants, N = 5) positive area in panel (A) or (B), respectively. Bars represent means with SD. (F) Alcian blue-stained goblet cells at 5 dpf. (G) Enteroendocrine cells (2F11+) in the intestine bulb at 4 dpf. (H) Quantification of Alcian blue-stained (siblings, N = 5; mutants, N = 5) or 2F11-positive (siblings, N = 5; mutants, N = 5) cells in panel (F) or (G), respectively. Bars represent means with SD. (I) Gut lumen labeled by DCFH-DA at 5 dpf. (J) WISH using the pan-endodermal marker foxA3 at 2 dpf. (K) Quantification of the liver and pancreas area labeled by foxA3 (siblings, N = 6; mutants, N = 6) in panel (J). Bars represent means with SD. White arrowhead: liver; black arrowhead: exocrine pancreas; blue arrowhead: endocrine pancreas; red arrowhead: intestine. |
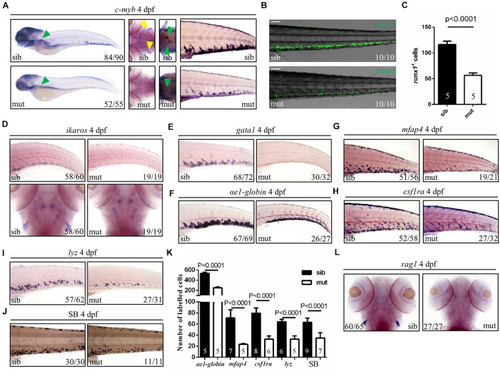
Figure 3. Defects of definitive hematopoiesis in ltv1Δ14/Δ14 mutant. (A) WISH of HSPC marker c-myb in the thymus, kidney and CHT at 4 dpf. (B) Representative confocal images of ltv1Δ14/Δ14; runx1:en-gfp mutants and siblings at 4 dpf. (C) Quantification of runx1+ cells of ltv1Δ14/Δ14; runx1:en-gfp mutants (N = 5) and siblings (N = 5) at 4 dpf. Bars represent means with SD. (D) WISH of HSPC marker ikaros in the CHT and thymus at 4 dpf. (E–I) WISH of erythrocyte progenitor marker gata1 (E), erythrocyte marker αe1-globin (F), macrophage markers mfap4 (G) and csf1ra (H), and neutrophil marker lyz (I) in the CHT at 4 dpf. (J) Sudan Black-stained neutrophils in the CHT at 4 dpf. (K) Quantification of αe1-globin, mfap4, csf1ra, lyz, and SB-positive (Sudan Black) cells in panels (F–J), respectively. Numbers of each group are shown in the respective columns. Bars represent means with SD. (L) WISH of lymphocyte marker rag1 at 4 dpf. Yellow arrowhead: thymus; green arrowhead: kidney. Scale bar: 100 μm. EXPRESSION / LABELING:
PHENOTYPE:
|
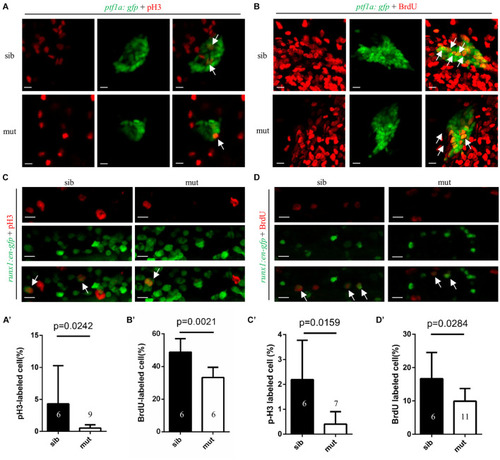
Figure 4. Impaired proliferation of exocrine pancreas progenitors and HSPCs in ltv1Δ14/Δ14 mutant. (A,B) Representative confocal images of pH3 immunostaining (A) or BrdU labeling (B) in ltv1Δ14/Δ14; ptf1a:gfp mutants and siblings at 2 dpf. (A’,B’) The percentage of pH3+ (A’, siblings, N = 6; mutants, N = 9) or BrdU+ (B’, siblings, N = 6; mutants, N = 6) cells within the ptf1a+ population in ltv1Δ14/Δ14 mutants and siblings at 2 dpf. Bars represent means with SD. (C,D) Representative confocal images of pH3 immunostaining (C) and BrdU labeling (D) in ltv1Δ14/Δ14; runx1:en-gfp mutants and siblings at 2.5 dpf. (C’,D’) The percentage of pH3+ (C’, siblings, N = 6; mutants, N = 7) and BrdU+ (D’, siblings, N = 6; mutants, N = 11) cells within the runx1+ population in ltv1Δ14/Δ14 mutants and siblings at 2.5 dpf. Bars represent means with SD. White arrow: merged cell. Scale bar: 10 μm. |
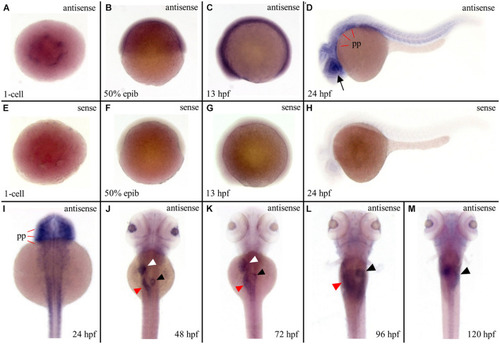
Figure 5. Strong expression of ltv1 in digestive organs. (A,I–M) Dorsal views. (B–D) Lateral views, anterior to the left. (A–D,I–M) WISH using ltv1 antisense probe in wild-type embryos at the stages as indicated in each panel. (E–H) As a negative control, ltv1 sense probe is used to perform the WISH. Black arrow: eye. White arrowhead: liver. Red arrowhead: intestine. Black arrowhead: exocrine pancreas. pp: pharyngeal primordia. |

Figure 6. Defects in 18S rRNA processing in ltv1Δ14/Δ14 mutant. (A) Schematic diagram showing the processing pathway of 28S, 18S, and 5.8S rRNAs. The hybridization sites of each probe are indicated by red bars, respectively. (B,C) Northern blot analysis using the corresponding probes as indicated to detect 18S rRNA or the intermediate products of rRNA processing. Asterisk: unidentified rRNA intermediate product. (D) Representative analysis result by E-bioanalyzer. (E) The ratio of 28S/18S rRNA is increased in ltv1Δ14/Δ14 mutants (N = 5), as compared with siblings (N = 5). Bars represent means with SD. ETS, external transcribed spacer; ITS, internal transcribed spacer. (F) Representative ribosome fractionation results of siblings and ltv1Δ14/Δ14 mutants at 4 dpf. The peaks of 40S, 60S, and 80S are indicated by arrows. Red dots on the curves represent the lowest points flanking the peaks. The area under respective peaks of 40S, 60S, and 80S, circled by curves, dashed lines, and baselines are measured. (G) Percentages of 40S, 60S, and 80S in total lysate in siblings and ltv1Δ14/Δ14 mutants at 4 dpf. Bars represent means with SD. Quantifications of three independent experiments are analyzed. PHENOTYPE:
|

Figure 7. P53 Independence of phenotypes in ltv1Δ14/Δ14 mutant. (A) WISH of p53 probe for detecting both p53 and Δ113p53 at 3 dpf. (B) Western blot results of P53 protein of p53ATG MO-treated or MO-untreated mutants and siblings at 3 dpf. (C) Evaluation of expression of p53 and its transcriptional targets Δ113p53 and p21 by quantitative PCR. EXPRESSION / LABELING:
PHENOTYPE:
|

Unillustrated author statements PHENOTYPE:
|