
FIGURE 4
- ID
- ZDB-IMAGE-211029-75
- Publication
- Zhang et al., 2021 - The Ribosome Biogenesis Factor Ltv1 Is Essential for Digestive Organ Development and Definitive Hematopoiesis in Zebrafish
- All Figures
- Figures for Zhang et al., 2021
|
FIGURE 4
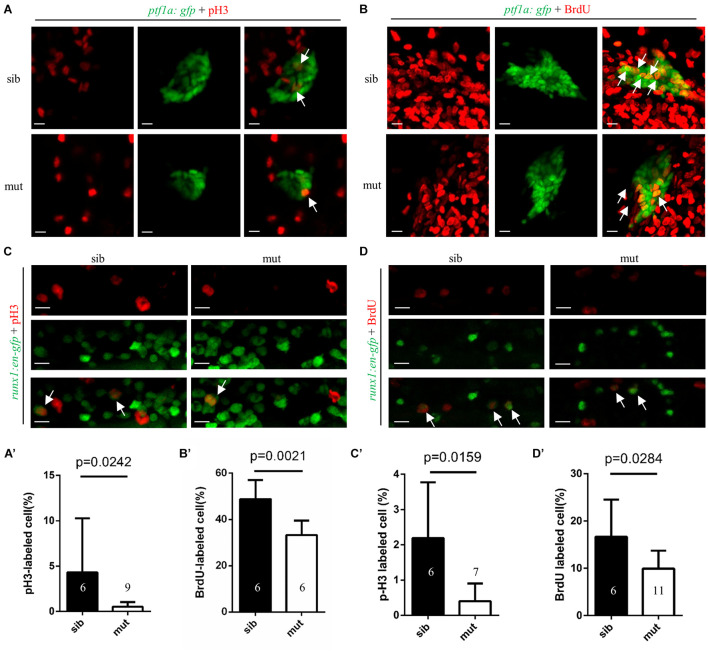
Figure 4. Impaired proliferation of exocrine pancreas progenitors and HSPCs in ltv1Δ14/Δ14 mutant. (A,B) Representative confocal images of pH3 immunostaining (A) or BrdU labeling (B) in ltv1Δ14/Δ14; ptf1a:gfp mutants and siblings at 2 dpf. (A’,B’) The percentage of pH3+ (A’, siblings, N = 6; mutants, N = 9) or BrdU+ (B’, siblings, N = 6; mutants, N = 6) cells within the ptf1a+ population in ltv1Δ14/Δ14 mutants and siblings at 2 dpf. Bars represent means with SD. (C,D) Representative confocal images of pH3 immunostaining (C) and BrdU labeling (D) in ltv1Δ14/Δ14; runx1:en-gfp mutants and siblings at 2.5 dpf. (C’,D’) The percentage of pH3+ (C’, siblings, N = 6; mutants, N = 7) and BrdU+ (D’, siblings, N = 6; mutants, N = 11) cells within the runx1+ population in ltv1Δ14/Δ14 mutants and siblings at 2.5 dpf. Bars represent means with SD. White arrow: merged cell. Scale bar: 10 μm.