
- Title
-
Canonical Wnt signalling regulates epithelial patterning by modulating levels of laminins in zebrafish appendages
- Authors
- Nagendran, M., Arora, P., Gori, P., Mulay, A., Ray, S., Jacob, T., Sonawane, M.
- Source
- Full text @ Development

Correlation between cellular pattern and Wnt signalling gradient in the median fin fold epithelium. (A) Bright-field image of 24 hpf wild-type zebrafish embryo. The dotted box represents the region of the fin epithelium imaged by confocal microscopy. (B-G) E-cadherin staining and aspect ratio plots of median fin epithelial cells at 24 (B,E), 30 (C,F) and 36 hpf (D,G) in wild-type embryos. Aspect ratios are plotted against the distance of the cells from the base of the fin fold along PD axis. (H-I′) β-Catenin-DAPI overlays (H,I) and β-catenin staining (H′,I′) and its quantification (H",I") in median fin epithelium at 24 hpf (H-H′) and 30 hpf (I-I′). (J-K′) Tg(7XTCF-Xia.Siam:GFP)ia4 line showing GFP expression in the distal cells of the median fin at lower magnification (J) and at higher magnification (K,K′) along with E-cadherin staining. Arrowheads in H,H′ indicate nuclear β-catenin. Scale bars: 10 μm B-D,H-I′,K,K′ ; 50 μm in J. AU, arbitrary units. |
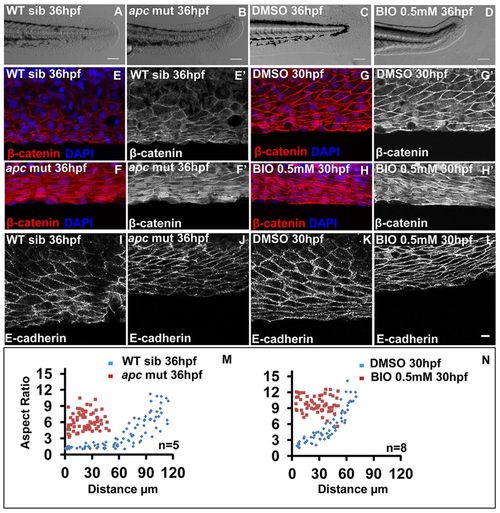
Gain of Wnt signalling results in acquisition of stretched cell morphology in the median fin fold. Bright-field images of wild-type sibling (A), apc mutant (B), DMSO- (C) and 0.5 mM BIO-treated (D) embryos. (E-H′) β-Catenin-DAPI overlays (E-H) and β-catenin staining (E′-H′) in given genetic backgrounds and treatments. (I-L) E-cadherin staining in wild-type siblings (I), apc mutant (J), DMSO control (K) and BIO-treated (L) embryos. (M,N) Comparison of epithelial cell aspect ratio plots between sibling and apc mutant (M) as well as between DMSO and BIO-treated embryos (N). Scale bars: 0.1mm in A-D; 10 μm in E-L. |
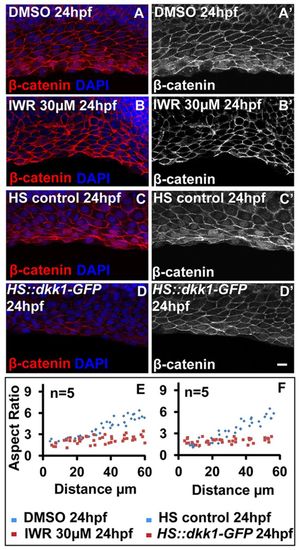
Loss of Wnt signalling results in polygonal morphology throughout the median fin epithelium. (A-D′) β-Catenin-DAPI overlays (A-D) and β-catenin staining (A′-D′) in DMSO- (A,A′), IWR-treated (B,B′), heat-shock control (C,C′) and HS:dkk1-GFP embryos (D,D′) at 24 hpf. (E,F) Comparison of aspect ratios between DMSO and IWR-treated (E), and heat-shock control and HS:dkk1-GFP embryos (F). Scale bar: 10 μm. |
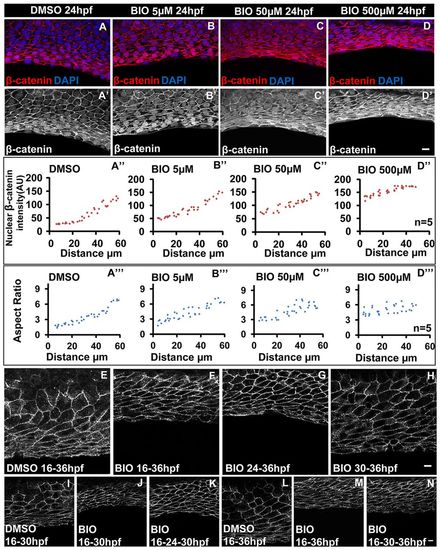
Canonical Wnt signalling is required persistently within a specific time window to alter cell shapes. (A-D′) β-Catenin-DAPI overlays (A-D) and β-catenin staining (A′-D′) in DMSO control (A,A′) and embryos treated with the mentioned doses of BIO drug (B-D,B′-D′). (A"-D") Comparison of nuclear β-catenin levels (A"-D") and aspect ratio plots (A′′′-D′′′) for DMSO control and embryos treated with the mentioned doses of BIO. (E-H) E-cadherin staining in embryos treated with DMSO (E) and with 0.5 mM BIO at 16 (F), 24 (G) and 30 (H) hpf. (I,J,L,M) Cell-shape analysis in DMSO control (I,L) and embryos treated with BIO from 16 hpf continuously and analysed at 30 (J) and at 36 (M) hpf. (K,N) Embryos in which the drug was (K) washed off at 24 hpf and cell shape analysis carried out at 30 hpf or (N) washed off at 30 hpf and analysed at 36 hpf. Scale bars: 10 μm. AU, arbitrary units. |
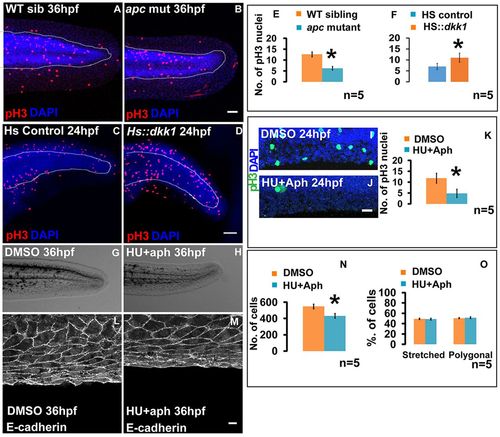
Patterning in the median fin epithelium is not influenced by proliferation rates and total cell numbers. Phospho-histone 3 and DAPI staining under given genetic conditions or treatments at 24 hpf (A-D,I,J). (E,F,K) Quantification reveals decrease in proliferation in apc mutant (E) and drug (HU+aph) treated (K) embryos, and an increase in HS:dkk1-GFP embryos (F) when compared with their respective controls. (G,H) Median fin morphology at 36 hpf in DMSO- (G) and HU+aph-treated embryos (H). (L,M) Cellular morphology in 36 hpf control (L) and HU+aph-treated (M) embryos. (N) Comparison of total number of cells in the fin fold of DMSO control and HU+aph-treated embryos. Proportions of stretched and polygonal cells in control and HU+aph-treated embryos at 36 hpf (O). Scale bars: 50 μm in A-D,I,J; 10 μm in L,M. *P<0.01 (Student′s t-test). |
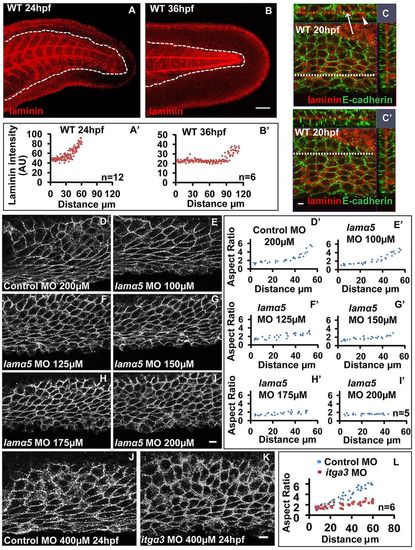
Laminin α5 regulates cellular patterning in the median fin fold. Maximum intensity projections of laminin staining and plot for laminin intensities across the PD axis at 24 (A,A′) and 36 (B,B′) hpf. (C,C′) Laminin and E-cadherin staining in the fin-fold of 20 hpf embryo. Orthogonal sections (along the y-axis and x-axis; white dotted lines in C and C′ represent where the section along the x-axis is taken) are for the distal (C) and proximal (C′) parts of the median fin fold epithelium. (D-I′) Analysis of cell shape in the median fin fold of embryos at 30hpf injected with control (D) and indicated doses of lama5 morpholino (E-I) and the corresponding aspect ratios along the PD axis (D′-I′). (J-L) In comparison with control (J), distal cells in the fin fold of itga3 morphants (K) show polygonal morphology, as revealed by the aspect ratio plot (L). Scale bars: 50 μm in A,B; 10 μm in C-K). Arrow and arrowhead in C indicate extracellular and intracellular laminin, respectively. AU, arbitrary units. EXPRESSION / LABELING:
|

Canonical Wnt signalling regulates the levels of laminins in the median fin fold. (A) Graph showing transcript level changes of laminins under gain and loss of canonical Wnt signalling by qRT-PCR. (B-C′′′′) Maximum intensity projections of laminin staining in the fin fold of sibling (B), apc mutant (B′), HS control (C) and HS::dkk-GFP (C2) embryos, their respective orthogonal sections (B",B′′′,C",C′′′) and plots comparing laminin intensities across PD axis in given genetic conditions (B′′′′,C′′′′). (D-I′) In situ hybridisation using lama5 probes in given genetic backgrounds or treatments (D-I) and sections of stained embryos (D′-I′). (J-M) Cell shape analysis in apc mutant (J,K) and 0.5 mM BIO-treated embryos (L,M) injected with control (J,L) or lama5 morpholino (K,M). The extent of cell stretching is reduced in the absence of lama5 function (K,M). Scale bars: 50 μm in B-C′ ; 10 μm in J-M. |
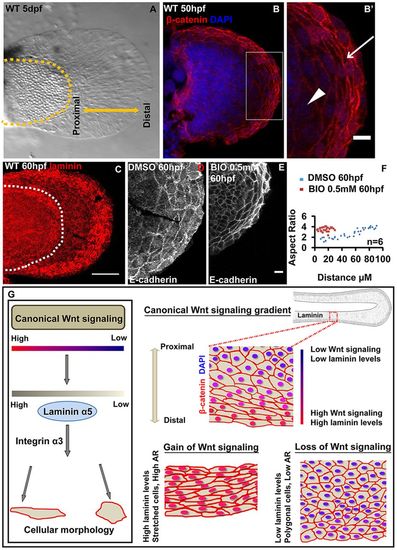
Mechanisms patterning median fin fold epithelium are also conserved in the pectoral fin. Bright-field image (A) of 5dpf wild-type pectoral fin. β-Catenin and DAPI-stained pectoral fin (B) and its digitally zoomed (B′) region (box in B). Arrow in B′ indicates stretched epithelial cells at the distal end, whereas arrowhead indicates polygonal cells. (C) Maximum intensity projections of wild-type larval pectoral fin stained for laminin. Confocal images showing E-cadherin staining in DMSO- (D) or BIO-treated (E) larval pectoral fins. (F) Comparison of aspect ratios of pectoral fin epithelial cells in DMSO and BIO-treated larvae. (G) Model showing the regulation of epithelial patterning in zebrafish fin-fold epithelium by the canonical Wnt signalling gradient. A gradient of canonical Wnt activity exists along the PD axis of the fin fold. The gain- and loss-of-function analyses reveal that the extent of canonical Wnt signalling regulates the expression of the ECM component laminin α5, which directly regulates cell shapes by interacting with integrin α3. Scale bars: 10 μm in B′,D,E; 50 μm in B,C. AR, aspect ratio. |