
|
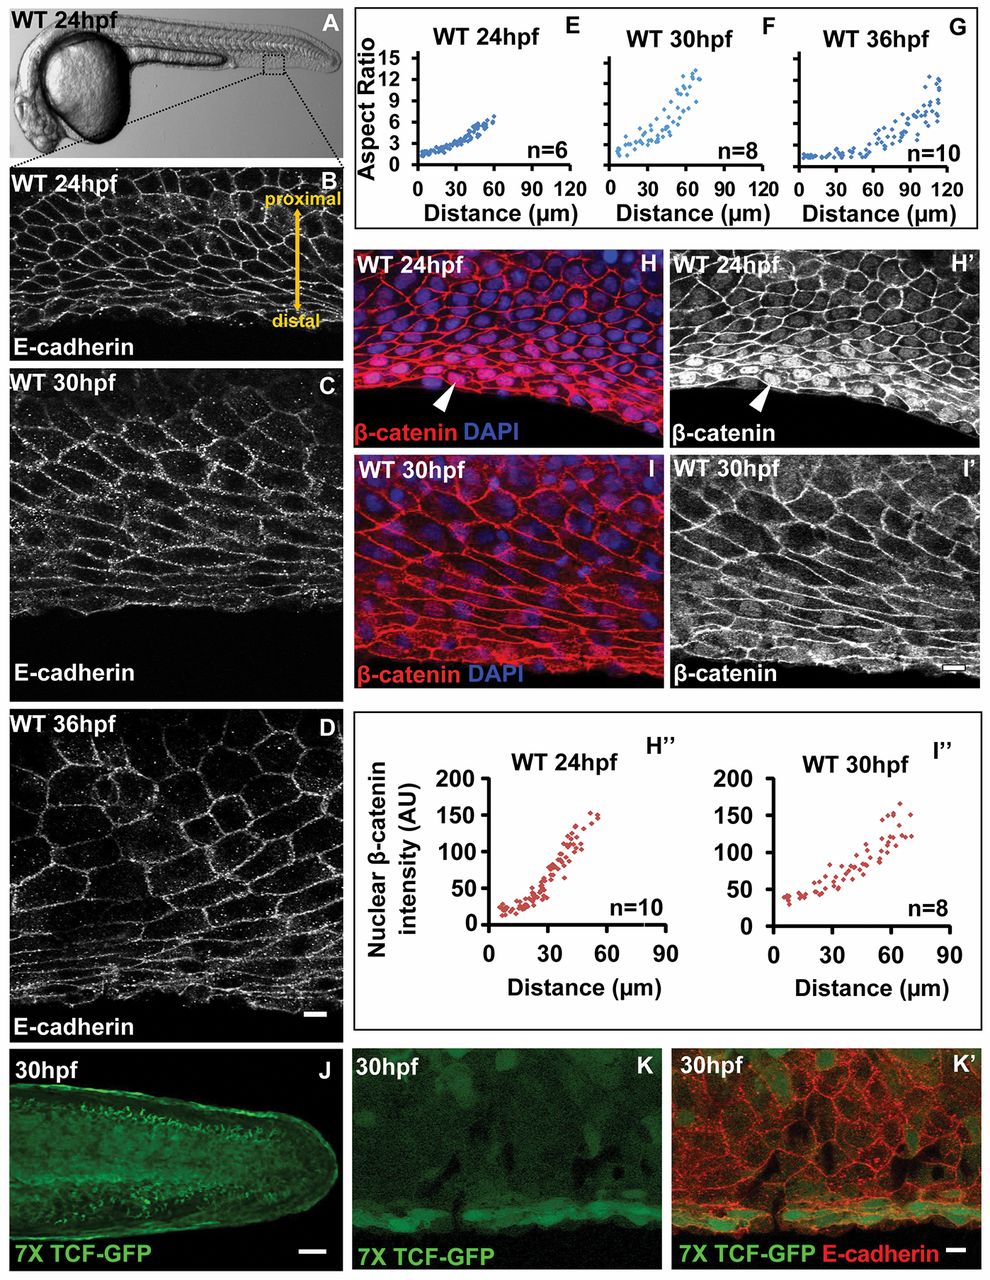
Fig. 1 Correlation between cellular pattern and Wnt signalling gradient in the median fin fold epithelium. (A) Bright-field image of 24 hpf wild-type zebrafish embryo. The dotted box represents the region of the fin epithelium imaged by confocal microscopy. (B-G) E-cadherin staining and aspect ratio plots of median fin epithelial cells at 24 (B,E), 30 (C,F) and 36 hpf (D,G) in wild-type embryos. Aspect ratios are plotted against the distance of the cells from the base of the fin fold along PD axis. (H-I′) β-Catenin-DAPI overlays (H,I) and β-catenin staining (H′,I′) and its quantification (H",I") in median fin epithelium at 24 hpf (H-H′) and 30 hpf (I-I′). (J-K′) Tg(7XTCF-Xia.Siam:GFP)ia4 line showing GFP expression in the distal cells of the median fin at lower magnification (J) and at higher magnification (K,K′) along with E-cadherin staining. Arrowheads in H,H′ indicate nuclear β-catenin. Scale bars: 10 μm B-D,H-I′,K,K′ ; 50 μm in J. AU, arbitrary units.