
Fig. 6
- ID
- ZDB-IMAGE-150629-15
- Antibodies
- Publication
- Nagendran et al., 2015 - Canonical Wnt signalling regulates epithelial patterning by modulating levels of laminins in zebrafish appendages
- All Figures
- Figures for Nagendran et al., 2015
|
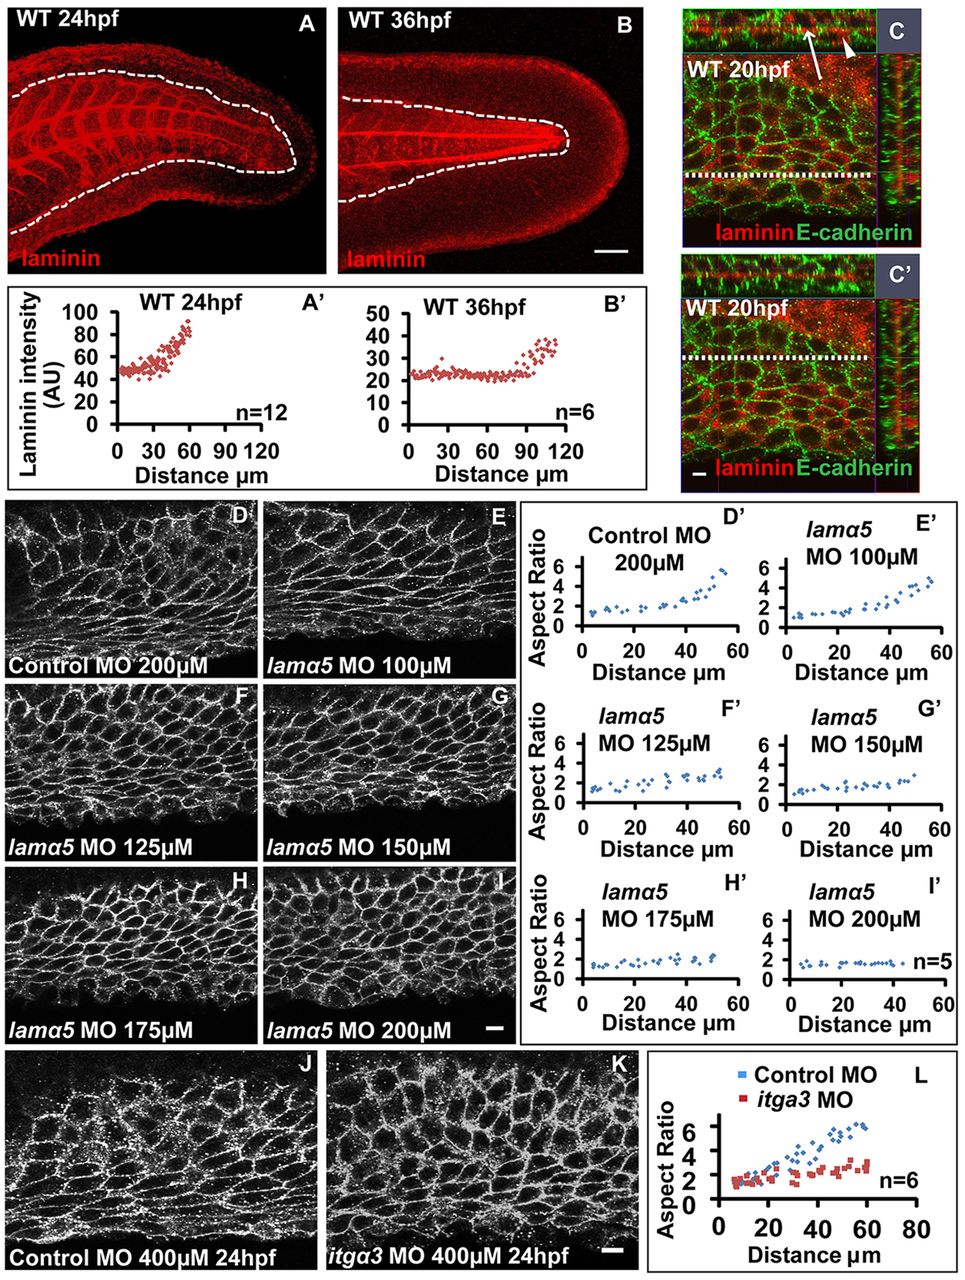
Fig. 6 Laminin α5 regulates cellular patterning in the median fin fold. Maximum intensity projections of laminin staining and plot for laminin intensities across the PD axis at 24 (A,A′) and 36 (B,B′) hpf. (C,C′) Laminin and E-cadherin staining in the fin-fold of 20 hpf embryo. Orthogonal sections (along the y-axis and x-axis; white dotted lines in C and C′ represent where the section along the x-axis is taken) are for the distal (C) and proximal (C′) parts of the median fin fold epithelium. (D-I′) Analysis of cell shape in the median fin fold of embryos at 30hpf injected with control (D) and indicated doses of lama5 morpholino (E-I) and the corresponding aspect ratios along the PD axis (D′-I′). (J-L) In comparison with control (J), distal cells in the fin fold of itga3 morphants (K) show polygonal morphology, as revealed by the aspect ratio plot (L). Scale bars: 50 μm in A,B; 10 μm in C-K). Arrow and arrowhead in C indicate extracellular and intracellular laminin, respectively. AU, arbitrary units.