- Title
-
Graded levels of Pax2a and Pax8 regulate cell differentiation during sensory placode formation
- Authors
- McCarroll, M.N., Lewis, Z.R., Culbertson, M.D., Martin, B.L., Kimelman, D., and Nechiporuk, A.V.
- Source
- Full text @ Development
|
PPA fate-map. (A) NLS-Kaede photoconversion in the PPA (dashed outline) of a Tg(pax2a:GFP)e1 transgenic embryo at 12 hpf. Insets show single z-planes at high magnification before (left inset; arrow) and after (right inset) photoconversion. The Pax2a domain is delineated by GFP expression (dashed outline). (B) Confocal projection showing labeled cells (red; arrows) at 24 hpf. Red nuclei outside the otic vesicle are incidentally photoconverted epidermal cells. (C) Confocal projection of a caged fluorescein-dextran photoconversion (arrow) in the PPA of a Tg(pax2a:GFP)e1 transgenic embryo at 12 hpf. (D,D′) Confocal projection showing labeled cells (green) and Pax2a+ cells (red) at 24 hpf. (E) Fate map of the 12 hpf Pax2a domain, divided into 12 regions, each containing ~3×4 (12 total) cells except for corners where cell numbers vary. The location of labeled cells was assessed at 24 hpf and the proportion of labeling events recorded for each of the 12 regions. In instances in which multiple tissues were labeled at 24 hpf, proportions were calculated by dividing the number of endpoint label instances by the total number of labeled tissues resulting from labeling each region. (F) Fate map of all labeling events from five selected subregions (2, 5, 8, 9 and 12). F, facial placode; gAll/gVIII, anterior lateral line ganglion/acoustic ganglion; G+V, glossopharyngeal/vagal placodes; MHB, midbrain hindbrain boundary; OV, otic vesicle. Scale bars: 50 μm in main panels, 5 μm in insets. |
|
PPA cells are required for normal epibranchial and otic placode development. (A,B) Confocal projection of a Tg(pax2a:GFP)e1 transgenic zebrafish embryo; anterior quarter (A) or posterior third (B) of the PPA was ablated at 12 hpf. Ablated region indicated by dotted line. (C-F) Embryos shown in A and B were Pax2a immunolabeled at 24 hpf, showing expression in otic vesicle and EB placodes. (C,D) Ablated and contralateral sides of the embryo in A. Facial placode on the ablated side exhibits an 81% reduction versus contralateral control; otic and posterior EB placodes are unaffected. (E,F) Ablated and contralateral sides of the embryo in B. Ablated side shows 95% loss of the otic vesicle and 72% reduction in the glossopharyngeal/vagal placodes versus control. Facial placode is unaffected. Arrows indicate corresponding placodes on ablated and control sides. Scale bar: 50 μm |
|
Differential levels of Pax2a expression in the zebrafish PPA. (A,A′) Low, uniform Pax2a expression at 11 hpf. Heat map in A′ shows fluorescence intensity. (B,B′) At 12 hpf, Pax2a expression levels occur in a wider range. (C,C′) Fully segregated placodal precursors with structures exhibiting differential Pax2a expression at 24 hpf. The otic placode exhibits high Pax2a expression; the EB placodes display low levels (C′). (D) Pax2a fluorescence mean gray value (MGV) distribution at 11 and 12 hpf (n≥175 cells, seven embryos per time point). Note significant increase in the number of cells with high Pax2a expression at 12 hpf (χ2-test; P<<0.001). High Pax2a levels defined as MGV>100. Scale bars: 50 μm. |
|
High levels of Pax2a bias otic contribution. (A-B′′) Zebrafish embryos expressing bi-directional heat-shock-inducible plasmid (heat-shocked at 12 and 14 hpf) driving egfp (A-A′′) or pax2a (B-B′′) in one direction and dTomato (dTom) in the other. Arrows indicate Pax2a-misexpressing cells sequestered to otic placode. Arrowheads indicate cells segregated to EB placodes. (C) Relative contribution of dTomato+ cells to the otic vesicle and EB placodes at 24 hpf in EGFP (controls) and Pax2a (overexpression) embryos. Pax2a-overexpressing cells are prone to otic contribution, segregating less frequently to EB placodes versus controls (n≥192 cells from 8-12 embryos per condition; χ2-test; **P<0.016, ***P<0.001). f, facial placode; g+v, glossopharyngeal/vagal placodes; HS, heat-shock; ov, otic vesicle. Scale bars: 50 μm. |
|
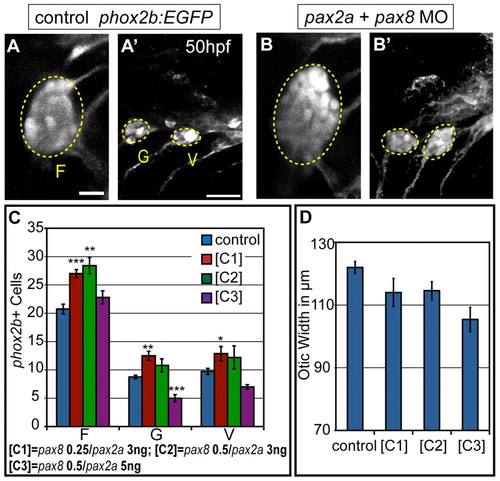
Partial knockdown of pax2a and pax8 transcripts increases cell numbers in EB ganglia. Zebrafish zygotes carrying the TgBAC(phox2b:EGFP)w37 transgene were injected with different amounts of pax2a+pax8 MOs; EB ganglion cell numbers were assayed at 50 hpf. (A,A′) Confocal projection in uninjected control. Facial (F), glossopharyngeal (G) and vagal (V) ganglia (dashed ovals) contain 20, nine and eight EGFP-positive cells, respectively. (B,B2) Confocal projection of an embryo injected with 3+0.25 ng of pax2a+pax8 MOs. Note increased size of G and small V ganglia (F, 29; G, 13; V, 13 cells). (C) Quantification of cells in F, G and small V ganglia in controls and embryos that received increasing doses of pax2a+pax8 MOs. Note significant size increase in all ganglia at [C1]. ***P<0.001, **P<0.005, *P<0.05. (D) Quantification of otic width (longest A-P segment in μm) of controls and embryos receiving increasing doses of pax2a+pax8 MOs (Student′s t-test, P=0.056). n≥33 cells, eight embryos per condition. Error bars represent s.e.m. Scale bars: 10 μm in A; 25 μm in A′. |
|
Overactivation of Wnt signaling increases levels of Pax2a expression and biases cells to an otic commitment. (A-C) Confocal projections of DMSO- and BIO-treated zebrafish embryos between 11 and 12 hpf and analyzed for Pax2a expression in the PPA. (A′-C′) Heat maps show increased Pax2a levels after BIO treatment. (D-F) Confocal projection of embryos treated with DMSO or BIO between 11 and 24 hpf and immunolabeled with Pax2a. In BIO-treated embryos, the otic vesicle is larger, whereas EB placodes are significantly reduced (80-100% decrease) (G) Analysis of PPA Pax2a+ cells in control and BIO-treated embryos (2.5 and 5.0 μM) at 12 hpf (n≥354 cells, five embryos per condition) shows dose-dependent increases in expression from low (MGV<120) to high (MGV>120) (χ2, P<<0.001). (H) Comparison of MGVs for Pax2a fluorescence in the otic vesicle showed a significant increase in Pax2a expression levels following BIO treatment (Student′s t-test; **P<0.007; ***P<0.001). (I) Pax2a+ cell number in the otic vesicle showed a 2.47-fold increase in 2.5 μM BIO and a 1.5-fold increase in 5.0 μM BIO versus controls (Student′s t-test; **P<0.01; ***P<0.001). (J) Percentage of Pax2a+ mitotic cells in the otic vesicle dropped at 18 hpf following 10-hour-long BIO treatment (*P<0.05; n=12 embryos per condition). (K) The percentage of Pax2a+ cells that were also Caspase-3+ at 18 hpf in embryos treated with BIO between 10-18 hpf (n=12 embryos per condition) was unchanged. f, facial placode; g+v, glossopharyngeal/vagal placodes; MGV, mean gray value; ov, otic vesicle. Scale bars: 50 μm. |
|
Inhibition of Wnt signaling reduces Pax2a levels resulting in a cell segregation shift from otic to facial placode. (A-C′) Confocal projections from control and Tg(hsp70:tcf?C-EGFP) zebrafish embryos heat-shocked at 10 hpf and analyzed for Pax2a expression at 12 hpf. Note decreased Pax2a levels in heat map images as heat-shock stringency increases (A′-C′). (D-F) Control and Tg(hsp70:tcf?C-EGFP)+ embryos heat-shocked at 10 hpf and analyzed for Pax2a expression at 24hpf (arrowheads, facial placode; arrows, otic vesicle; asterisks, putative otic sensory patches). (G) PPA Pax2a expression MGVs at 12 hpf. Note significant shift from high to low Pax2a levels with increased heat-shock stringency (χ2-test; P<<0.001). (H) Average MGV of Pax2a expression in the otic vesicle was significantly reduced in Tg(hsp70:tcf?C-EGFP)+ embryos (heat-shocked at 39°C) versus controls (n≥317 cells from five embryos per condition; unpaired t-test; **P<0.003). (I) Quantification of Pax2a+ cells in control and Wnt-inhibited embryos (heat-shocked at 39°C) reveals significant otic vesicle and glossopharyngeal/vagal placode cell losses, with concurrent increases in facial placode (***P<0.001; **P<0.01). (J) Percentage of mitotic cells (by pH3 immunolabeling) at 18 hpf following heat-shock of Tg(hsp70:tcf?C-EGFP) embryos at 10 hpf was unchanged versus uninduced controls (n=12 embryos per condition). (K) There is no significant change in Caspase-3+ cell percentage at 18 hpf following heat-shock of Tg(hsp70:tcf?C-EGFP) embryos at 10 hpf (n=12 embryos per condition). Error bars represent s.e.m. f, facial placode; g+v, glossopharyngeal/vagal placodes; MGV, mean gray value; ov, otic vesicle. Scale bars: 50 μm. |
|
Wnt activation is required cell-autonomously for otic commitment. (A-C′′) Wild-type zebrafish hosts containing rhodamine-dextran-positive cells from wild-type (red, A) or Tg(hsp70:tcf?C-EGFP) (yellow, B,C) donors were heat-shocked at 10 hpf and immunolabeled for Pax2a (cyan) at 24 hpf. Cells derived from Tg(hsp70:tcf?C-EGFP) donors appear yellow owing to colocalization of EGFP and rhodamine-dextran. Arrowheads indicate donor cells in EB placodes; white arrows mark donor cells in the otic vesicle, green arrows mark donor cells in presumptive gAll/gVIII. (D) Relative contributions of donor cells to otic vesicle and EB placodes at 24 hpf in wild-type and Tg(hsp70:tcf?C-EGFP) transplants. Tg(hsp70:tcf?C-EGFP)+ cells are biased towards facial and glossopharyngeal/vagal placodes, rarely segregating to the otic vesicle [total of 77 and 131 donor cells counted from 11 Tg(hsp70:tcf?C-EGFP) and ten wild-type transplants, respectively; χ2-test; ***P<<0.001]. Scale bar: 50 μm. |
|
Characterization of the Tg(pax2a:GFP)e1 PPA domain. (A-A′′) Confocal projection of a Tg(pax2a:GFP)e1 embryo at 12 hpf immunostained for Pax2a. Significant overlap was seen between transgenic GFP and endogenous Pax2a; 97% of α-Pax2+ cells were GFP+ (n=380 cells from five embryos) and 87% of GFP+ cells were α-Pax2+ (n=420 cells from five embryos). (B-B22) Confocal projection of a Tg(pax2a:GFP)e1 embryo at 24 hpf co-stained with the Pax2 antibody. Few cells in the EB placodes are labeled with the transgene at this stage. Ectopic expression of transgene is seen in the acoustic and anterior lateral line ganglion (gVIII/gAll) and rhombomeres 3 and 5 (R3 and R5). (C) Confocal projection of a Tg(pax2a:GFP)e1 transgenic embryo at 12 hpf. (D) Total number of cells of the PPA, in addition to number of cell diameters along the A-P (red marker) and M-L (yellow marker) axes, were counted in 11 embryos (1186 cells total from 11 embryos) to determine variability in dimensions of this domain. Counts reveal a consistent average (Ave) with a small standard error of mean (SEM) for both total number of cells and cells across the A-P and M-L axes in the PPA of 12 hpf embryos. ov, otic vesicle; gVIII/gAll, acoustic/anterior lateral line ganglia; A-P, anterior-posterior; M-L, medial-lateral. Scale bars: 50 μm. |
|
Differential levels of pax2a/8 are observed in the PPA and mature placodes. (A-C) In situ hybridization of pax2a reveals differential pax2a expression levels at both 12 (B) and 24 (C) hpf. (D-F) In situ hybridization for pax8 reveals presence of this transcript in the PPA at 11 (D) and 12 (E) hpf; pax8 is also expressed in the EB placodes and in distinct foci in the otic vesicle at 24 hpf (F). Note the differential expression levels of pax8 at 12 and 24 hpf with low level pax8 in the EB placode. Arrowheads indicate low expression; arrows indicate high pax expression. Scale bars: 50 μm. |
|
Injection of hsp70-dTomato-pax2a plasmid induces robust Pax2a expression following heat-shock. (A-A2′) Embryos injected with a heat-shock-inducible construct expressing both Pax2a and the dTomato reporter were heat-shocked at 12hpf. These embryos display mosaic Pax2a expression 3 hours post-heat-shock. Arrows indicate cells with ectopic Pax2a expression. (B) Quantification of induced Pax2a levels relative to endogenous Pax2a. Note that on average ectopic Pax2a levels are 2.9-fold higher than the endogenous levels (n=42 cells from five embryos; Student?s t-test, ***P<<0.001). Error bars represent s.e.m. (C) Distribution of Pax2a fluorescence intensity comparing endogenous Pax2a with ectopically induced Pax2a. Note that overall intensity levels of the exogenous Pax2a fall within a high endogenous spectrum (n=198 cells from five embryos). Scale bar: 50 μm. |
|
Combined activity of Pax2a and Pax8 is necessary for formation of the EB ganglia. (A,B) Embryos derived from a pax2ab593/+ incross immunolabeled with anti-Elavl3/4 to mark differentiated EB neurons in control (A) and embryos injected with 1 ng of pax8-MO (B). Note near-complete loss of Elavl3/4+ neurons in the EB ganglia of the pax2a mutant that also received pax8-MO (B). (C-F) Confocal projection from 50 hpf Tg(phox2b:EGFP)w37 embryos. Control embryos (C,E) were compared with embryos injected with either 0.25 ng of pax8-MO (D) or 3.0 ng of pax2a-MO (F). (G,H) Quantification of phox2b+ neurons at 50 hpf in the facial, glossopharyngeal and most anterior small vagal ganglia in embryos injected with 0.25 ng of pax8-MO (G) and 3.0 ng pax2a-MO (H) versus controls (n≥34 cells from five embryos per condition). Note the lack of significant difference in ganglion sizes when MOs are singly injected at suboptimal concentrations. Error bars represent s.e.m. (I) RT-PCR of pax2a splice variant products from embryos that were injected with increasing amounts of pax2a MO. The amount of an RT-PCR product corresponding to an aberrant splice variant (arrow) increased with respect to injected pax2a-MO in a dose-dependent manner. Scale bars: 25 μm. |
|
Injection of suboptimal amounts of pax2a MO results in a reduction in Pax2a protein levels in cells of the PPA at 12 hpf. (A-B′) Control embryos and embryos injected with 3 ng of pax2a-MO were immunolabeled with anti-Pax2 antibody at 12 hpf. Suboptimal MO levels were defined by titration experiments. Note that 3 ng of pax2a MO results in an overall reduction, but not complete absence, of Pax2a protein in the PPA (A′ vs B′). (C) Distribution of mean gray values of Pax2a levels in control and pax2a-MO injected embryos (n≥393 cells from seven embryos per condition). Note the significant decrease (χ2-test, P<<0.001) in the number of cells with high Pax2a expression in embryos injected with pax2a-MO. Scale bar: 50 μm. |
|
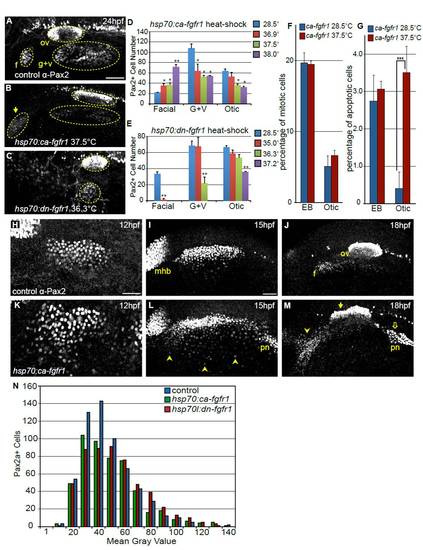
Modulating Fgf signaling affects size of the otic and EB placodes. (A-C) Representative confocal projections of embryos immunolabeled with anti-Pax2 antibody at 24 hpf including: control (A), constitutively active Fgfr1 Tg(hsp70:ca-fgfr1)pd3 transgene (B) and dominant-negative Fgfr1 Tg(hsp70:dnfgfr1-EGFP)pd1 transgene (C). Heat-shock induction for both constructs was carried out at 10 hpf. Note an increase in the number of Pax2+ cells in the facial placode (arrow in B) and concurrent reduction in the G+V placodes and dysmorphia in the otic vesicle following Fgf upregulation. By contrast, inhibition of Fgf results in loss of the facial placode with a concomitant reduction in the otic vesicle and G+V placodes (C). (D) Quantification of Pax2+ cells in the otic vesicle and EB placodes in control embryos (no heat-shock) and Tg(hsp70:ca-fgfr1)pd3 embryos heat-shocked at various temperatures (36.9, 37.5 and 38°C). Note the 3.4-fold increase in the number of Pax2+ cells in the facial placode following heat-shock at 38°C, with concomitant decrease of the G+V placodes and otic vesicle (Student?s t-test, **P<0.0075). (E) Quantification of Pax2+ cells in the otic vesicle and EB placodes in control embryos (no heat-shock) and Tg(hsp70:dnfgfr1-EGFP)pd1 embryos following heat-shock at various temperatures (35, 36.3 and 37.2°C). Note the <95% reduction in the facial placode following 35°C heat-shock (Student?s t-test, **P<0.002), and complete loss of this placode at higher inductive temperatures. Whereas the G+V placodes are unaffected at lower inductive conditions, there is a 68% reduction (Student?s t-test **P<0.004) and a complete loss of this domain following heat-shock at 36.3°C and 37.2°C, respectively. By contrast, the number of Pax2a+ cells in the otic vesicle is only reduced following heat-shock at the 37.2°C (46% reduction; Student?s t-test **P<0.001). (F) Percentage of Pax2a+ cells undergoing mitosis was measured by immunolabeling with a pH3 antibody at 18 hpf. There is no significant change in proliferation following 10 hpf heat-shock of Tg(hsp70:ca-fgfr1)pd3 embryos, compared with uninduced controls (n=12 embryos per condition). (G) Percentage of Pax2a+ cells undergoing apoptosis as measured by immunolabeling with Caspase-3 antibody at 18 hpf. There is a significant increase of cell death in the otic placode following 10 hpf heat-shock of Tg(hsp70:ca-fgfr1)pd3 embryos (n=12 embryos per condition). (H-M) Pax2a expression at 12, 15 and 18 hpf in control embryos (H-J) or Tg(hsp70:ca-fgfr1)pd3 transgenic embryos following heat-shock induction at 10 hpf (K-M). Note additional Pax2a+ cells lateral to the PPA at 15 hpf (L, arrowheads); and expansion and fusion of Pax2a+ cells in the pronephros (pn) with the PPA. By 18 hpf a striking expansion of the facial placode can be observed (arrowheads), concurrent with a dysmorphic otic vesicle (filled arrow) expansion and mislocalization of the pronephros (M, open arrow). (N) Distribution of Pax2a fluorescence intensity in PPA cells at 12 hpf in control, Tg(hsp70:dnfgfr1-EGFP)pd1 and Tg(hsp70:ca-fgfr1)pd3 following 10 hpf heat- shock. Note that the overall distribution of Pax2a intensity levels is unchanged regardless of Fgf levels (n≥504 cells from eight embryos per condition). Scale bars: 50 μm. |
|
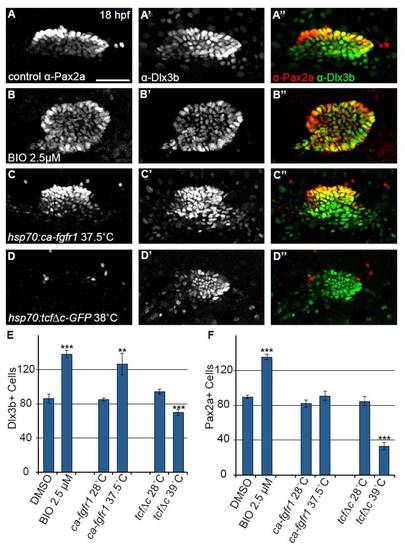
Number of Dlx3b+ cells in the otic vesicle is altered when Fgf and Wnt pathways are modulated. Confocal projections of 18 hpf embryos co-labeled with anti-Pax2a and anti-Dlx3b to assess expression in the developing otic vesicle. (A-A′′) Control embryos reveal that at 18 hpf Pax2a and Dlx3b exhibit extensive colocalization; however, a number of lateral otic cells that either express very low Pax2a levels or do not express Pax2a at all are Dlx3b+. (B-B′′) Embryos treated with 2.5 μM BIO starting at 11 hpf show a concomitant increase in both Pax2a and Dlx3b+ cells. (C-C′′) 10 hpf heat-shock of Tg(hsp70:ca-fgfr1)pd3 embryos caused an increase in number of Dlx3b+ cells but also yielded a high level of cell disorganization. (D-D′′) Pax2a expression in the otic cells is completely lost following inhibition of Wnt signaling by 10 hpf heat-shock of Tg(hsp70:tcf?C-EGFP). Otic cells retained Dlx3b expression; however, the overall number of otic cells is reduced versus control. (E) Quantification of Dlx3b+ cells in the otic vesicle at 18 hpf following various treatments. This analysis revealed a 60% increase in Dlx3b+ cells in the otic vesicle after BIO treatment (Student?s t-test ***P<<0.001) a 49% increase in Dlx3b+ cells after Tg(hsp70:ca-fgfr1)pd3 induction (Student?s t-test **P<0.006), and a 25% reduction in the number of Dlx3b+ cells after induction of Tg(hsp70:tcf?C-EGFP) (Student?s t-test ***P<<0.001; n=6 embryos per condition). (F) Quantification of Pax2a+ cells in the otic vesicle at 18 hpf following the above treatments. The analysis revealed a 51% increase in Pax2a+ cells in the otic vesicle after BIO treatment (Student?s t-test ***P<<0.001), no significant change in Pax2a+ cells in Tg(hsp70:ca-fgfr1)pd3 induced embryos, and a 61% reduction in Pax2a+ cells after Tg(hsp70:tcf?C-EGFP) induction (Student?s t-test ***P<<0.001; n=6 embryos per condition). Error bars represent s.e.m. Scale bar: 50 μm. |
|
Overactivation of Wnt signaling severely reduces or blocks EB ganglia formation. Confocal projection images of the otic vesicle and EB ganglia at 50 hpf. Tg(phox2b:EGFP)w37 embryos were treated with 2.5 and 5.0 μM BIO beginning 11 hpf, then washed out at 24 hpf. Embryos were allowed to develop until 50 hpf, at which time they were assessed for EB ganglion formation by EGFP expression and for otic vesicle formation by DAPI labeling. (A-C) Whereas DMSO-treated control embryos had normal development of the otic vesicle and EB ganglia, approximately half of 2.5 μM BIO-treated embryos had severely reduced EB ganglia and the remaining half had no EBs. (D) BIO (5.0 μM)-treated embryos resulted in a complete loss of EBs. Scale bar: 25 μm. |
|
BIO regulates Pax2a levels and promotes otic cell commitment through the Wnt pathway. (A,B) Tg(hsp70:tcf?C-EGFP) embryos in which transgene was not activated were treated at 11 hpf with either DMSO (A) or 2.5μM BIO (B). In embryos treated with BIO we saw supernumerary Pax2+ cells in the otic vesicle and increased Pax2a levels. (C,D) Tg(hsp70:tcf?C-EGFP) embryos that were heat-shocked at 10 hpf, yielded the same phenotype in both DMSO- (C) and 2.5µM BIO- (D) treated embryos, indicating that BIO is modulating Pax2 levels and otic fate via canonical Wnt (n=5 embryos per condition). Scale bar: 50 μm. |
|
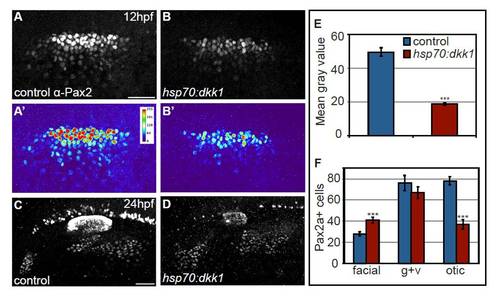
Global Wnt inhibition by Dkk1 expression attenuates Pax2a levels. (A-D) Control and Tg(hsp70:dkk1-GFP)w32 embryos were heat-shocked at 10 hpf and assayed for Pax2a expression at 12 and 24 hpf. Heat maps generated from control (A′) and transgenic embryos (B′) reveal reduced Pax2a levels in the PPA at 12 hpf following heat-shock. Note that upregulation of Dkk1 caused an increase in facial placode size with a concurrent reduction in the size of the otic vesicle. (E) Mean gray values of Pax2a levels in the otic vesicle at 24 hpf revealed a 2.6-fold reduction in the Dkk1-induced embryos (Student?s t-test, ***P<<0.001). (F) Control and Tg(hsp70:dkk1-GFP)w32 embryos were heat-shocked at 10 hpf, collected at 24 hpf and analyzed for Pax2a+ cell number in the otic vesicle and EB placodes. This analysis revealed a 48% increase in the number of cells that segregate to the facial placode (Student?s t-test, ***P<0.001), with a concomitant 47% reduction in the number of cells in the otic placode (Student?s t-test ***P<0.001). There was no significant difference in the number of cells in the glossopharyngeal/vagal placode in these experiments. Scale bar: 50 μm. |
|
Modulation of Wnt signaling at early somitogenesis does not affect expression of fgf3 and fgf8 in the hindbrain. fgf3 and fgf8 expression were assayed by in situ hybridization at 13 hpf after modulating Wnt signaling at 10 hpf. (A-H) Neither fgf3 nor fgf8 expression is grossly altered when Wnt signaling is blocked by induction of Tg(hsp70:tcf?C-EGFP) transgene or overactivated by BIO treatment, compared with uninduced Tg(hsp70:tcf?C-EGFP) embryos or DMSO-treated controls. Scale bar: 50 μm. |


