
|
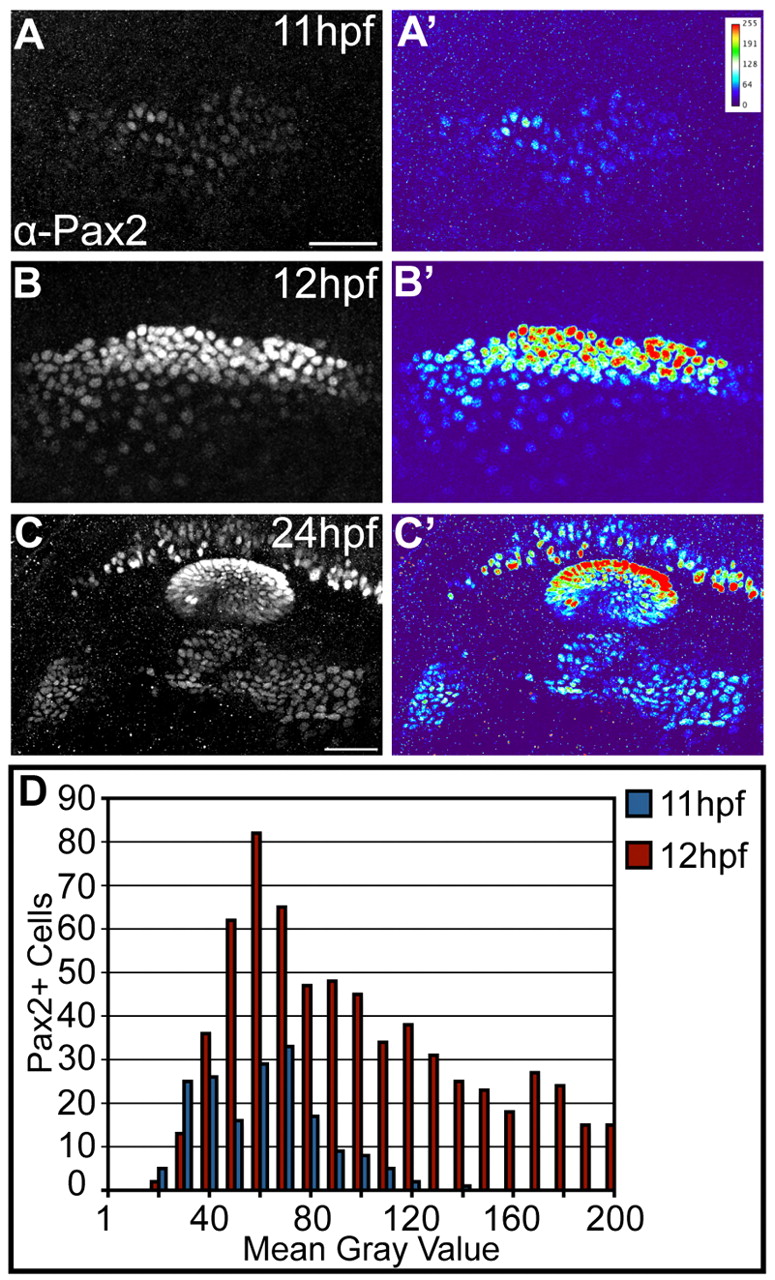
Fig. 3 Differential levels of Pax2a expression in the zebrafish PPA. (A,A′) Low, uniform Pax2a expression at 11 hpf. Heat map in A′ shows fluorescence intensity. (B,B′) At 12 hpf, Pax2a expression levels occur in a wider range. (C,C′) Fully segregated placodal precursors with structures exhibiting differential Pax2a expression at 24 hpf. The otic placode exhibits high Pax2a expression; the EB placodes display low levels (C′). (D) Pax2a fluorescence mean gray value (MGV) distribution at 11 and 12 hpf (n≥175 cells, seven embryos per time point). Note significant increase in the number of cells with high Pax2a expression at 12 hpf (χ2-test; P<<0.001). High Pax2a levels defined as MGV>100. Scale bars: 50 μm.