
Fig. S8
- ID
- ZDB-FIG-120803-25
- Publication
- McCarroll et al., 2012 - Graded levels of Pax2a and Pax8 regulate cell differentiation during sensory placode formation
- Other Figures
- All Figure Page
- Back to All Figure Page
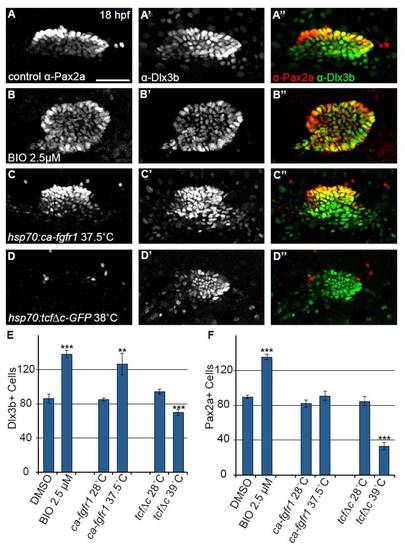
Number of Dlx3b+ cells in the otic vesicle is altered when Fgf and Wnt pathways are modulated. Confocal projections of 18 hpf embryos co-labeled with anti-Pax2a and anti-Dlx3b to assess expression in the developing otic vesicle. (A-A′′) Control embryos reveal that at 18 hpf Pax2a and Dlx3b exhibit extensive colocalization; however, a number of lateral otic cells that either express very low Pax2a levels or do not express Pax2a at all are Dlx3b+. (B-B′′) Embryos treated with 2.5 μM BIO starting at 11 hpf show a concomitant increase in both Pax2a and Dlx3b+ cells. (C-C′′) 10 hpf heat-shock of Tg(hsp70:ca-fgfr1)pd3 embryos caused an increase in number of Dlx3b+ cells but also yielded a high level of cell disorganization. (D-D′′) Pax2a expression in the otic cells is completely lost following inhibition of Wnt signaling by 10 hpf heat-shock of Tg(hsp70:tcfΔC-EGFP). Otic cells retained Dlx3b expression; however, the overall number of otic cells is reduced versus control. (E) Quantification of Dlx3b+ cells in the otic vesicle at 18 hpf following various treatments. This analysis revealed a 60% increase in Dlx3b+ cells in the otic vesicle after BIO treatment (Student’s t-test ***P<<0.001) a 49% increase in Dlx3b+ cells after Tg(hsp70:ca-fgfr1)pd3 induction (Student’s t-test **P<0.006), and a 25% reduction in the number of Dlx3b+ cells after induction of Tg(hsp70:tcfΔC-EGFP) (Student’s t-test ***P<<0.001; n=6 embryos per condition). (F) Quantification of Pax2a+ cells in the otic vesicle at 18 hpf following the above treatments. The analysis revealed a 51% increase in Pax2a+ cells in the otic vesicle after BIO treatment (Student’s t-test ***P<<0.001), no significant change in Pax2a+ cells in Tg(hsp70:ca-fgfr1)pd3 induced embryos, and a 61% reduction in Pax2a+ cells after Tg(hsp70:tcfΔC-EGFP) induction (Student’s t-test ***P<<0.001; n=6 embryos per condition). Error bars represent s.e.m. Scale bar: 50 μm. |