
Fig. S7
- ID
- ZDB-FIG-120803-26
- Publication
- McCarroll et al., 2012 - Graded levels of Pax2a and Pax8 regulate cell differentiation during sensory placode formation
- Other Figures
- All Figure Page
- Back to All Figure Page
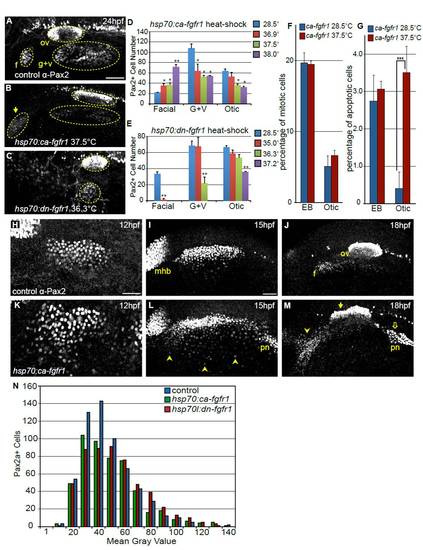
Modulating Fgf signaling affects size of the otic and EB placodes. (A-C) Representative confocal projections of embryos immunolabeled with anti-Pax2 antibody at 24 hpf including: control (A), constitutively active Fgfr1 Tg(hsp70:ca-fgfr1)pd3 transgene (B) and dominant-negative Fgfr1 Tg(hsp70:dnfgfr1-EGFP)pd1 transgene (C). Heat-shock induction for both constructs was carried out at 10 hpf. Note an increase in the number of Pax2+ cells in the facial placode (arrow in B) and concurrent reduction in the G+V placodes and dysmorphia in the otic vesicle following Fgf upregulation. By contrast, inhibition of Fgf results in loss of the facial placode with a concomitant reduction in the otic vesicle and G+V placodes (C). (D) Quantification of Pax2+ cells in the otic vesicle and EB placodes in control embryos (no heat-shock) and Tg(hsp70:ca-fgfr1)pd3 embryos heat-shocked at various temperatures (36.9, 37.5 and 38°C). Note the 3.4-fold increase in the number of Pax2+ cells in the facial placode following heat-shock at 38°C, with concomitant decrease of the G+V placodes and otic vesicle (Student’s t-test, **P<0.0075). (E) Quantification of Pax2+ cells in the otic vesicle and EB placodes in control embryos (no heat-shock) and Tg(hsp70:dnfgfr1-EGFP)pd1 embryos following heat-shock at various temperatures (35, 36.3 and 37.2°C). Note the <95% reduction in the facial placode following 35°C heat-shock (Student’s t-test, **P<0.002), and complete loss of this placode at higher inductive temperatures. Whereas the G+V placodes are unaffected at lower inductive conditions, there is a 68% reduction (Student’s t-test **P<0.004) and a complete loss of this domain following heat-shock at 36.3°C and 37.2°C, respectively. By contrast, the number of Pax2a+ cells in the otic vesicle is only reduced following heat-shock at the 37.2°C (46% reduction; Student’s t-test **P<0.001). (F) Percentage of Pax2a+ cells undergoing mitosis was measured by immunolabeling with a pH3 antibody at 18 hpf. There is no significant change in proliferation following 10 hpf heat-shock of Tg(hsp70:ca-fgfr1)pd3 embryos, compared with uninduced controls (n=12 embryos per condition). (G) Percentage of Pax2a+ cells undergoing apoptosis as measured by immunolabeling with Caspase-3 antibody at 18 hpf. There is a significant increase of cell death in the otic placode following 10 hpf heat-shock of Tg(hsp70:ca-fgfr1)pd3 embryos (n=12 embryos per condition). (H-M) Pax2a expression at 12, 15 and 18 hpf in control embryos (H-J) or Tg(hsp70:ca-fgfr1)pd3 transgenic embryos following heat-shock induction at 10 hpf (K-M). Note additional Pax2a+ cells lateral to the PPA at 15 hpf (L, arrowheads); and expansion and fusion of Pax2a+ cells in the pronephros (pn) with the PPA. By 18 hpf a striking expansion of the facial placode can be observed (arrowheads), concurrent with a dysmorphic otic vesicle (filled arrow) expansion and mislocalization of the pronephros (M, open arrow). (N) Distribution of Pax2a fluorescence intensity in PPA cells at 12 hpf in control, Tg(hsp70:dnfgfr1-EGFP)pd1 and Tg(hsp70:ca-fgfr1)pd3 following 10 hpf heat- shock. Note that the overall distribution of Pax2a intensity levels is unchanged regardless of Fgf levels (n≥504 cells from eight embryos per condition). Scale bars: 50 μm. |