
|
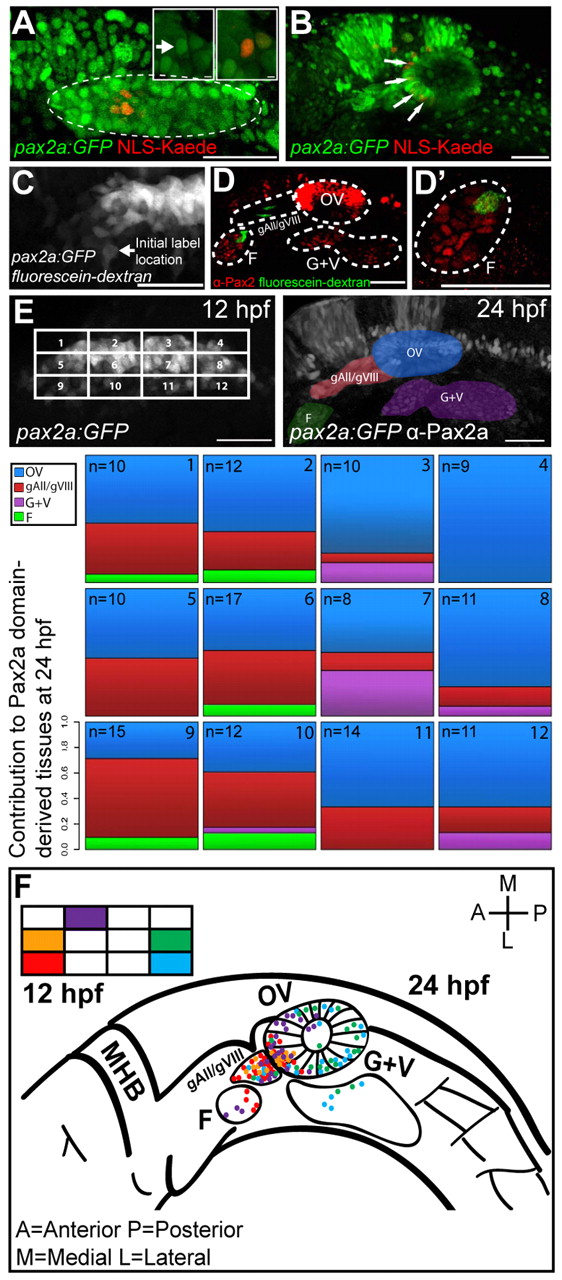
Fig. 1 PPA fate-map. (A) NLS-Kaede photoconversion in the PPA (dashed outline) of a Tg(pax2a:GFP)e1 transgenic embryo at 12 hpf. Insets show single z-planes at high magnification before (left inset; arrow) and after (right inset) photoconversion. The Pax2a domain is delineated by GFP expression (dashed outline). (B) Confocal projection showing labeled cells (red; arrows) at 24 hpf. Red nuclei outside the otic vesicle are incidentally photoconverted epidermal cells. (C) Confocal projection of a caged fluorescein-dextran photoconversion (arrow) in the PPA of a Tg(pax2a:GFP)e1 transgenic embryo at 12 hpf. (D,D′) Confocal projection showing labeled cells (green) and Pax2a+ cells (red) at 24 hpf. (E) Fate map of the 12 hpf Pax2a domain, divided into 12 regions, each containing ~3×4 (12 total) cells except for corners where cell numbers vary. The location of labeled cells was assessed at 24 hpf and the proportion of labeling events recorded for each of the 12 regions. In instances in which multiple tissues were labeled at 24 hpf, proportions were calculated by dividing the number of endpoint label instances by the total number of labeled tissues resulting from labeling each region. (F) Fate map of all labeling events from five selected subregions (2, 5, 8, 9 and 12). F, facial placode; gAll/gVIII, anterior lateral line ganglion/acoustic ganglion; G+V, glossopharyngeal/vagal placodes; MHB, midbrain hindbrain boundary; OV, otic vesicle. Scale bars: 50 μm in main panels, 5 μm in insets.