
|
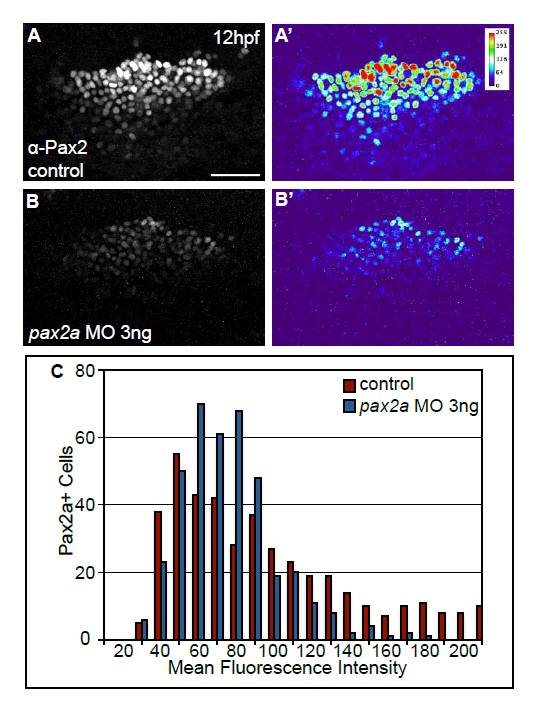
Fig. S6 Injection of suboptimal amounts of pax2a MO results in a reduction in Pax2a protein levels in cells of the PPA at 12 hpf. (A-B′) Control embryos and embryos injected with 3 ng of pax2a-MO were immunolabeled with anti-Pax2 antibody at 12 hpf. Suboptimal MO levels were defined by titration experiments. Note that 3 ng of pax2a MO results in an overall reduction, but not complete absence, of Pax2a protein in the PPA (A′ vs B′). (C) Distribution of mean gray values of Pax2a levels in control and pax2a-MO injected embryos (n≥393 cells from seven embryos per condition). Note the significant decrease (χ2-test, P<<0.001) in the number of cells with high Pax2a expression in embryos injected with pax2a-MO. Scale bar: 50 μm.