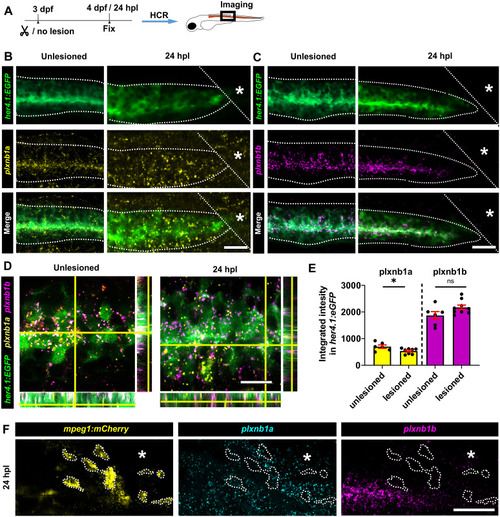
plxnb1a and plxnb1b are selectively expressed by spinal progenitors.
(A) A schematic indicating the experimental design for HCR. Photomicrographs are oriented as in Fig 3. (B-C) HCR-FISH in the her4.1:EGFP line indicate expression of plxnb1a (B) and plxnb1b (C) in spinal progenitor cells (her4.1:EGFP+) before and after injury. Dotted lines indicate the spinal cord boundaries. (D) High magnifications with orthogonal views of co-localization of plxnb1a and plxnb1b in her4.1:EGFP+ cells before and after injury are shown. (E) Quantification showing a slight decrease of plxnb1a expression after injury, but no changes in plxnb1b (plxnb1a: unlesioned 699.4 a.u, lesioned 532.9 a.u, Unpaired t test: p = 0.0340; plxnb1b: unlesioned 1,865 a.u., lesioned 2,171 a.u, Unpaired t test: p = 0.0797). (F) HCR-FISH in the mpeg1:mCherry line indicates very low expression of plxnb1a and no detectable expression of plxnb1b in BDM/microglial cells (outlined) after injury. Asterisks indicate the injury site in (B, C). Scale bars: 50 µm (B, C, F), 10 µm (D). Data files for graphs available in S2 Data.
|
