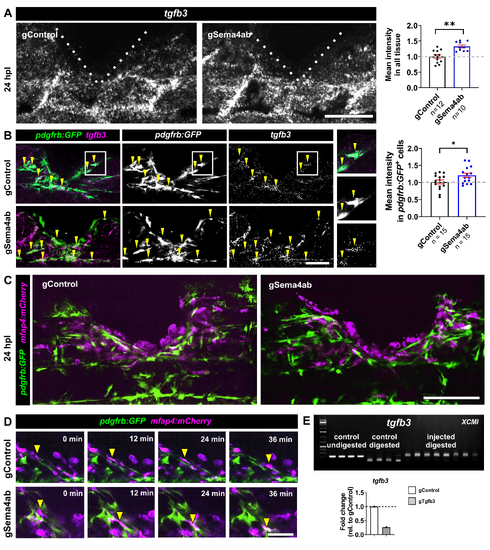
Experimental manipulations and cell interactions in the lesion.
(A) HCR-FISH for tgfb3 shows an increase in fluorescence intensity in lesioned sema4ab somatic mutants compared to lesioned control gRNA-injected fish at 24 hpl (gControl: 1.0 ± 0.058; gSema4ab: 1.3 ± 0.046; Unpaired t test: p = 0.0011). Dotted lines show the injury site. (B) HCR-FISH at 24 hpl shows tgfb3 expression in fibroblast-like cells (pdgfrb:GFP+; arrowheads). The mean intensity of the tgfb3 signal in pdgfrb:GFP+ cells shows an increase in sema4ab haCR-injected larvae at 24 hpl (+1.22-fold change, Unpaired t test p = 0.0322). (C) Individual frames of time-lapse movies show mfap4:mCherry+ cells in close contact to pdgfrb:GFP+ cells in both control gRNA-injected animals and in sema4ab somatic mutants. (D) Time series of movie frames show that mfap4:mCherry+ cells (arrowheads) migrate along fibroblast processes in both conditions. (E) RFLP and qPCR showing gRNA injection efficiency for tgfb3. For RFLP each lane represents one larva with and without digestion with the indicated restriction enzymes and with and without targeting these sites with gRNAs as indicated. Targeting the recognition sites with haCR gRNAs leads to efficient somatic mutation, as indicated by the almost complete resistance to digestion. Note a ~ 50% decay in the RNA detected by qPCR. Each dot for qRT-PCR represents a pool of 50 larvae. β-actin was used as housekeeping gene. Raw data for qRT-PCR can be found in S5 and S6 Data. Scale bars: 100 µm (A, C,), 50 µm (B) 15 µm (D). Data files for graphs available in S3 Data. Original gels with no adjustments can be found in S1 Raw Images.
|
