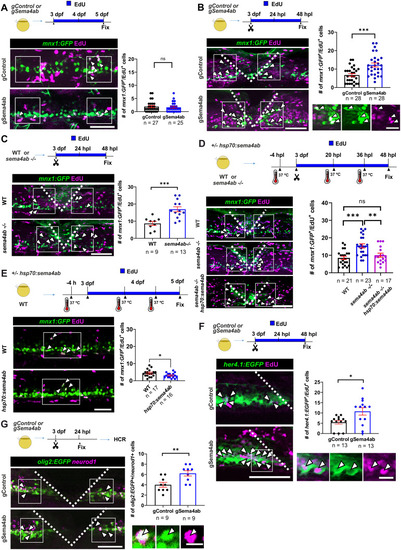
Sema4ab loss of function increases regenerative neurogenesis.
(A) Ongoing developmental neurogenesis of motor neurons (mnx1:GFP+/EdU+) is not different between gControl- and gSema4a-injected unlesioned larvae (gControl: 1.9 cells per larvae ± 0.3920; gSema4ab: 1.7 cells per larvae ± 0.3646; Mann–Whitney U test: p = 0.5972). (B) Lesion-induced generation of motor neurons (mnx1:GFP+/EdU+) is increased in somatic mutants for sema4ab (gControl: 6.9 cells per larva ± 0.8; gSema4ab: 12.9 cells per larva ± 1.1; Mann–Whitney U test: p = 0.0001). (D) Lesion-induced generation of motor neurons (mnx1:GFP+/EdU+) in germline mutants for sema4ab is also increased (WT: 8.7 cells per larva ± 1.2; sema4ab−/−: 16.9 cells per larva ± 1.5; Mann–Whitney U test: p = 0.0001). (D) Overexpression of sema4ab driven by a heat-shock promotor (hsp70:sema4ab) reduces over-production of motor neurons (mnx1:GFP+/EdU+) back to wild type levels in sema4ab germline mutants (WT: 8.5 cells per larva ± 0.95; sema4ab−/−: 15.4 cells per larva ± 1.2; sema4ab−/− + hsp70:sema4ab: 10 cells per larva ± 1.15; Kruskal–Wallis test: p = 0.0004; Dunn’s multiple comparisons test: ***p = 0.006; n.s > 0.9999, **p = 0.0168). All conditions shown were heat-shocked. (E) Overexpression of sema4ab in unlesioned larvae reduces ongoing developmental neurogenesis of motor neurons (mnx1:GFP+/EdU+) (WT: 4.4 cells per larva ± 0.52; hsp70:sema4ab: 3.0 cells per larva ± 0.37; Unpaired t test: p = 0.0374). (F) Lesion-induced proliferation of ERGs (her4.1:EGFP+/EdU+) is increased in somatic mutants for sema4ab (gControl: 5.4 cells per larva ± 0.9; gSema4ab: 10.77 cells per larva ± 1.8; Mann–Whitney U test: p = 0.0219). (G) The number of neurod1-labeled motor neuron progenitor cells (olig2:EGFP+/neurod1+) is increased after sema4ab disruption (gControl: 4.0 cells per larvae ± 0.4714; gSema4ab: 6.2 ± 0.5212 cells per larvae; Unpaired t test: p = 0.0060). Error bars show SEM. Scale bars: 50 µm (A, B, C, D, E, F, G), 10 µm (insets). Data files for graphs available in S2 Data.
|
