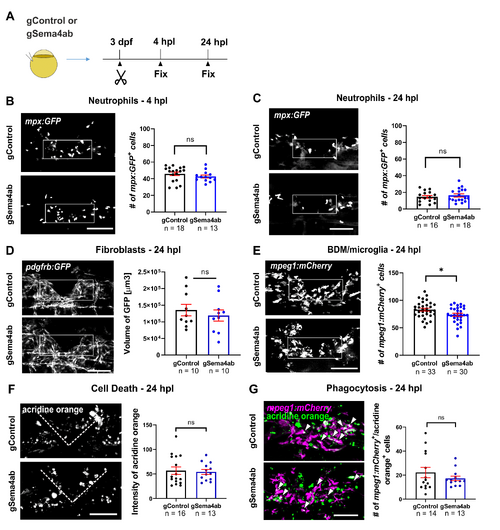
Cell recruitment and phagocytosis in the injury site are mostly comparable after sema4ab ablation.
(A) A schematic indicating the experimental design for B–E is shown. (B, C) Neutrophil numbers do not show differences at 4 hpl (B, gControl: 45.89 cells per larva ± 2.1; gSema4ab: 42.69 cells per larva ± 1.8; Mann–Whitney U test: p = 0.1854) and 24 hpl (C, gControl: 14.63 cells per larva ± 1.7; gSema4ab: 16.33 cells per larva ± 2.5; Mann–Whitney U test: p = 0.5005) in sema4ab somatic mutants compared to control gRNA-injected larvae. (D) The abundance of fibroblast-like cells, measured by GFP-positive volume, shows no differences between controls and somatic mutants for sema4ab at 24 hpl (gControl: 135,342 µm3 ± 17,127; gSema4ab: 118,911 µm3 ± 16,774; Mann–Whitney U test: p = 0.6842). (E) There is a reduction in the number of BDMs/microglia in gSema4ab compared to gControl larvae larvae at 24 hpl (gControl: 83.03 cells per larva ± 9.3; gSema4ab: 73.73 cells per larva ± 3.7; Mann–Whitney U test: p = 0.0156). (F) Cell death, measured by average labeling intensity of acridine orange in the lesion site, shows no differences between experimental groups (gControl: 56.67 ± 7.5; gSema4ab 54.27 ± 5.0; Mann–Whitney U test: p = 0.8123). (G) BDMs/microglia phagocytosis, evaluated by counting mpeg1:mCherry+ cells with engulfed acridine orange+ particles, shows no differences between groups (gControl: 22.21 cells per larva ± 4.327; gSema4ab 17.23 cells per larva ± 1.912; Mann–Whitney U test: p = 0.9714). White boxes designate quantification windows. Dotted lines outline the edges of the injury site. Error bars show SEM. Scale bars: 50 µm. Data files for graphs available in S3 Data.
|
