
- Title
-
Semaphorin3f as a cardiomyocyte derived regulator of heart chamber development
- Authors
- Halabi, R., Cechmanek, P.B., Hehr, C.L., McFarlane, S.
- Source
- Full text @ Cell Commun. Signal.
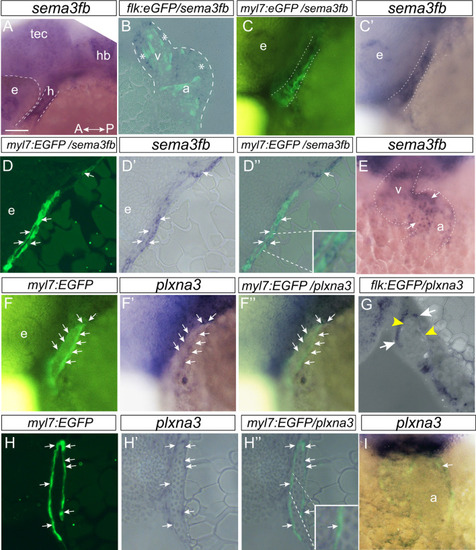
sema3fb is expressed by embryonic cardiomyocytes. A-E Whole mount (A,C,C’,E) and horizontal (B) and sagittal (D-D’’) sections of sema3fb ISH on 28 hpf (A,C,D), 36 hpf (B) and 48 hpf (E) zebrafish hearts. sema3fb is expressed through the heart chamber, in GFP positive cardiomyocytes in a Tg(myl7:EGFP) heart (C–C’,D-D’’) and surrounding (asterisks) GFP positive endocardial cells in a Tg(flk:EGFP) heart (B). Blends between the GFP and ISH signals (B,C,D’’). Inset (D’’) shows a sema3fb-expressing cardiomyocyte. F-I Whole mount (F-F’’,I) and sagittal (G-H) sections of plxna3 ISH of 28 hpf (F-F’’,H–H’’), 36 hpf (G) and 48 hpf (I) zebrafish hearts. plxna3 mRNA is present in GFP positive cardiomyocytes (arrows) in a Tg(myl7:EGFP) heart (F-F’,H–H’’) that surround the GFP positive endocardial cells (yellow arrowheads) in a Tg(flk:EGFP) heart (G). Blend between the GFP and ISH signals (F’’,G,H’’,I). A, anterior; a, atrium; e, eye; h, heart; hb, hindbrain; P, posterior; Tec, optic tectum; v, ventricle. Scale bar: 50 µm (A,C-D,F–H), 25 µm (B,E,I) |
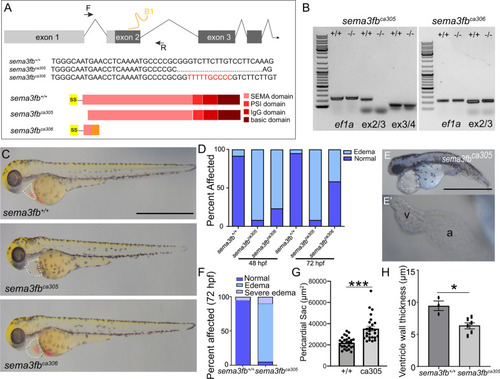
sema3fb mutants have cardiac edema. A Overview of the sema3fb locus targeted by CRISPR/Cas9 mutagenesis to exon 2 (guide RNA: B1) and primers used to identify the mutation. sema3fbca305 fish have a 19 bp deletion (dots) and sema3fbca306 fish have a 10 bp insertion (red sequence). Schematic representation of WT and mutant proteins. In the sema3fbca305 allele, exon 1 is spliced in frame with exon 3, with loss of 62 amino acids (aa) at the beginning of a protein that would be translated, including the signal sequence (ss) and the first 14 aa of the SEMA domain. In the sema3fbca306 allele, the 10 bp insertion introduces a frame shift and a premature stop codon to generate a predicted truncated 58 aa protein. F, forward primer; R, reverse primer. B RT-PCR indicates that exon 2 is skipped in the sema3fbca305 allele; no PCR product is generated with exon 2-exon 3 primers, but product is generated with exon 3-exon 4 primers. Exon 2-exon 3 primers reveal exon 2 is present in the sema3fbca306 allele. C Brightfield images of sema3fb+/+, sema3fbca305 and sema3fbca306 72 hpf embryos. Dotted line outlines the pericardial sac. D The percent of embryos that present with cardiac edema at 48 hpf (N = 3, n = 60 for each genotype) and 72 hpf (N = 3, n = 60 for each genotype). E The severe mutant phenotype displaying major cardiac edema and failure to thrive (E), and the abnormal linear arrangement of the heart (E’, inset in E). F Quantitation of the severe edema phenotype at 72 hpf (N = 3, n = 180 per genotype). G Quantitation of the area of the pericardial sac (N = 2; WT n = 27; sema3fbca305 n = 26, p < 0.0001). H The average ventricle wall width (µm) in 72 hpf sema3fbca305 (n = 6) embryos is significantly thinner (p = 0.024) than that of WT (n = 3). Scale bar in C and E is 1 mm PHENOTYPE:
|

sema3fb mutant embryos have reduced cardiac function. A, B Still images from videos of beating WT and sema3fbca305 mutant hearts at 72 hpf. Ventricle measurements were made in both the long axis (white line, L: length) and short axis (black line, W: width) to determine ventricle volumes. ba: bulbus arteriosus. C, D Quantitation of the average ventricle volume at end diastole (C) and end systole (D) reveals a significantly decreased capacity in the sema3fb mutant (p = 0.0027 and p = 0.0063, respectively) as compared to WT. E-I Graphs showing average heart rate (p = 0.0008) (E), cardiac output (p = 0.026) (F), stroke volume (p = 0.033) (G), ejection fraction (p = 0.45) (H), and fractional shortening (p = 0.17) (I). (N = 3; n = 12 sema3fb+/+, n = 20 sema3fbca305). Scale Bar: 100 µm PHENOTYPE:
|

Ventricle and atrium are smaller in sema3fb mutant embryos. Whole mount ISH of 48 hpf hearts. Dotted yellow lines mark the presumptive border between the atria and ventricle placed at the morphological atrioventricular constriction. A-C The cardiomyocyte marker tnnt2a reveals large chambers in the WT heart (N = 2, n = 16/18) (A), while both sema3fb mutant alleles present with small hearts (B, N = 2, 14/16; C, N = 2, 15/16). D Antero-posterior heart length (purple line, schematic) reveals smaller sema3fbca305 (p < 0.0001) and sema3fbca306 (p = 0.0016) hearts as compared to WT. E–G Mutant alleles (F,G) present with smaller myh7 + ventricles (N = 2, 17/20 sema3fbca305; N = 2, 15/18 sema3fbca306) than WT (N = 2, n = 19/20) (E), with loss of myh7 label at the AVC (yellow arrowheads). H Shorter ventricles (purple line, schematic) in sema3fbca305 (p = 0.009) and sema3fbca306 (p = 0.013) as compared to WT embryos. I-K Mutant alleles present with smaller myh6 + atria (N = 2, 18/21 sema3fbca305; N = 2, 15/17 sema3fbca306) (J,K) than in WT (N = 2, n = 19/19) (I), and ectopic myh6 label in the ventricles (yellow arrowheads). L Quantitation of area (purple fill) reveals smaller atria in sema3fbca305 (p = 0.0001) and sema3fbca306 (p < 0.0001) hearts as compared to WT. M, N myh6 expression at 72 hpf reveals a smaller sema3fbca305 (N = 2, n = 27) atrium as compared to WT (n = 18). O-R Expression of irx1a (O-P; N = 2; WT n = 15/15; sema3fbca305 n = 22/22) and tbx5a (Q-R; N = 2; WT n = 15/15; sema3fbca305 n = 15/15) in the ventricle, with arrows marking the morphological atrioventricular constriction. Insets (O,P) reveal the irx1a border at the AVC, and the dotted lines the length of the irx1a domain border. S Mean area of myh6 ISH label at 72 hpf (p = 0.0021). T Mean myh7(-) area measured between the morphological AVC and the posterior border of high myh7 expression (p < 0.0001). U, V myh7 ISH to mark ventricular cardiomyocytes and S46 antibody to label atrial cardiomyocytes. In the 48 hpf sema3fbca305 heart there is a gap between the two labels (bar) into which S46 immunolabel extends (arrows). A: anterior; a, atrium; P: posterior; v, ventricle. Scale bar 50 µm EXPRESSION / LABELING:
PHENOTYPE:
|
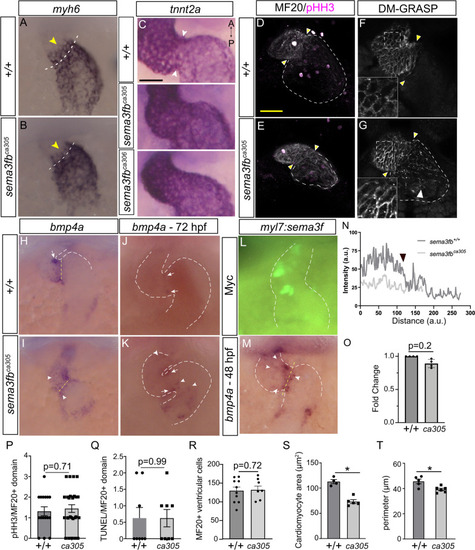
Chamber identity disrupted at the AVC with loss and overexpression of Sema3f. A, B myh6 in 36 hpf mutant hearts expressed anterior (arrowheads) to the AVC (dotted line). C Discrete change in tnnt2a ISH signal at the atrial-ventricular border in WT but not mutant 48 hpf heart (arrowheads). D-G Confocal of 48 hpf hearts immunolabeled for pHH3 and MF20 (D,E), and DM-GRASP (F,G). Discrete expression border at the AVC (yellow arrowheads) in WT (D, N = 1, n = 5/5, and F, N = 3, n = 11/12) but not mutant hearts (E, N = 1, n = 8/9 and G (white arrowhead), N = 3, n = 10/12). H–K bmp4a mRNA restriction to the AVC (arrows) in WT at 48 hpf (H, N = 4, n = 21/30) and 72 hpf (J, N = 1, n = 8/9), but expansion beyond the AVC (arrowheads) in mutants (I, 48 hpf, n = 36/45; K, 72 hpf, n = 10/11). L, M myl7:sema3f plasmid-driven Sema3f expression in heart cardiomyocytes, with immunolabeling for myc-tagged Sema3f (L) and ISH for bmp4a (M) at 48 hpf. bmp4a mRNA expands beyond the AVC with Sema3f overexpression (arrowheads, M; N = 2, n = 24/37 expanded) but not control (bmp4a n = 17/20). N Average RGB MF-20 immunolabel intensity across the antero-posterior heart axis. High expression in WT (n = 5) ventricle sharply tapering at the atrial border (~ 150 arbitrary units (a.u.); arrowhead) is not seen in mutants (n = 9). Note sema3fb mutant hearts are small. O RT-qPCR for bmp4a mRNA (N = 4, p = 0.68). P-R Mean pHH3 + actively dividing MF20 + cardiomyocytes (P, p = 0.71), TUNEL + /MF20 + cardiomyocytes (Q, p = 0.99), and MF20 + ventricular cardiomyocytes (R, p = 0.72) at 48 hpf. S, T Mean ventricular cardiomyocyte area (S) and perimeter (T) in sema3fbca305 as compared to WT (p = 0.016 and p = 0.03, respectively). N = 3, n = 4–5 WT and n = 6 mutants, with 9–12 DM-GRASP + cells/embryo. Scale bar in C is 40 µm and in D is 25 µm (A,B,D-M) EXPRESSION / LABELING:
PHENOTYPE:
|
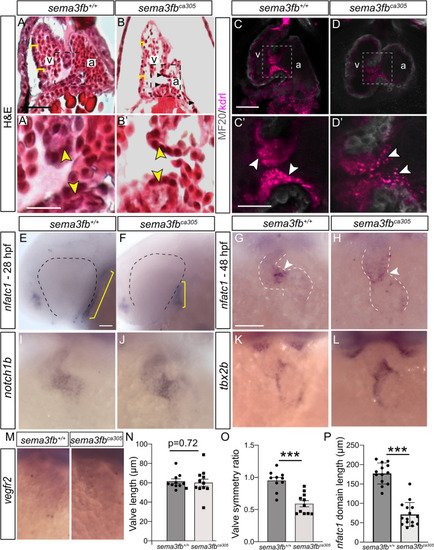
Disrupted heart valve development with the loss of Sema3fb. A, B Hematoxylin and eosin stained sections show the ventricle walls (yellow brackets) and valves (arrowheads within inset) of WT (A, A’) and sema3fbca305 embryos (B, B’) at 72 hpf. C, D Confocal projections of 72 hpf WT (C, C’) and mutant (D,D’) hearts immunolabeled by the myocardial marker MF20 (grey) on an endocardial-labeled transgenic line Tg(kdrl:mCherry). Brightness was increased in D’ to allow for comparison with C’. E, F nfatc1 ISH label in WT (E; N = 2, n = 13/13 normal) and sema3fbca305 (F, n = 13/15 short) 28 hpf embryos reveals a smaller endocardial domain (yellow bars). G, H nfatc1 concentration at the AVC (arrowheads) in WT (G, n = 21/21) and mutant (H, n = 16/17) 48 hpf fish. I-M AVC endocardial marker notch1b (I,J) (N = 2 WT n = 10/10; sema3fbca305 n = 10/10) and endocardial marker vegfr2 (M) (WT n = 10/12; sema3fbca305 n = 15/17) in 48 hpf hearts. Expansion of the tbx2b AVC cardiomyocyte marker in mutants (n = 7/8) that normally shows restricted expression at the AVC in WT hearts (n = 5/6) (K,L). N-P Quantitation of the: (1) length of the AV valve, as marked by mCherry in the Tg(kdrl:mCherry) background (N; N = 2, n = 10 sema3fb+/+, n = 12 sema3fbca305), (2) the ratio of the length of the valve present in the atrium to that measured in the ventricle at 72 hpf (O; p = 0.0003), and (3) the length of the nfatc1 domain (yellow bars, E and F) in 28 hpf WT (n = 13) and mutant (N = 15) embryos (P; p < 0.0001). Scale bars in A (A,B), A’ (A’,B’), C (C,D), C’ (C’,D’), E (E,F), G (G-M) are 50 µm EXPRESSION / LABELING:
PHENOTYPE:
|
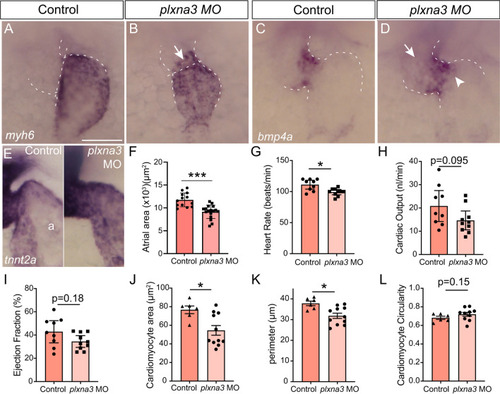
Plxna3 is a candidate receptor for Sema3fb. A, B myh6-expressing atria of control (A) and plxna3 (B) morpholino-injected 48 hpf embryos (N = 1 WT n = 5/5 normal; plxna3 MO, n = 9/15 small atria). White line indicates the morphological constriction between the atrium and ventricle, and arrow points to ectopic ISH label in the ventricle. C, D bmp4a expression in control (C) and plxna3 MO (D) embryos. Ectopic ISH label in the ventricle (arrow) and atria (arrowhead). E tnnt2a shows a sharp reduction at the AVC in a control (n = 8/8) but not a plxna3 MO (n = 7/10 imprecise) embryo. F Mean atrial area is reduced in plxna3 MO embryos (N = 2; p < 0.0001, n = 17) as compared to controls (n = 13). G-I Average heart rate (p = 0.011, G), cardiac output (p = 0.095, H), and ejection fraction (p = 0.18, I) (N = 3, n = 9 controls, n = 10 plxna3 MO). J-L Cell size of DM-GRASP + ventricular cardiomyocytes. A significant reduction is seen in cardiomyocyte area (J, p = 0.019) and perimeter (K, p = 0.015) in plxna3 MO as compared to control embryos, but not circularity (L, p = 0.15). N = 3, n = 6 control and n = 11 plxna3 MO embryos, with 8–10 cells/embryo. Scale bar in A is 50 µm EXPRESSION / LABELING:
PHENOTYPE:
|