
- Title
-
Midkine-a Regulates the Formation of a Fibrotic Scar During Zebrafish Heart Regeneration
- Authors
- Grivas, D., González-Rajal, Á., de la Pompa, J.L.
- Source
- Full text @ Front Cell Dev Biol
|
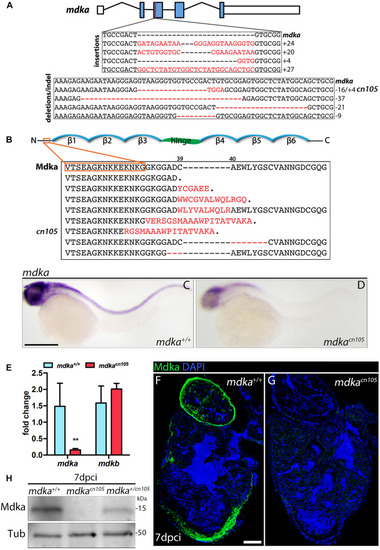
Generation of |

Loss of PHENOTYPE:
|
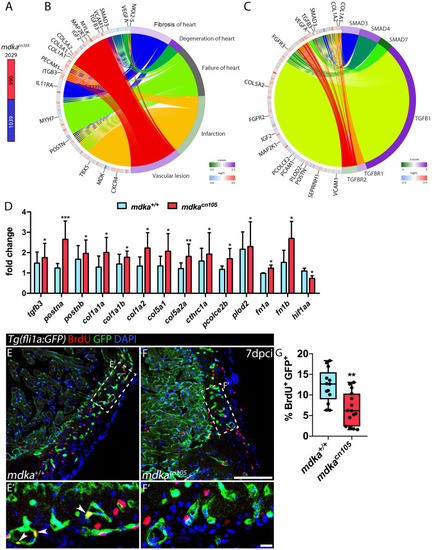
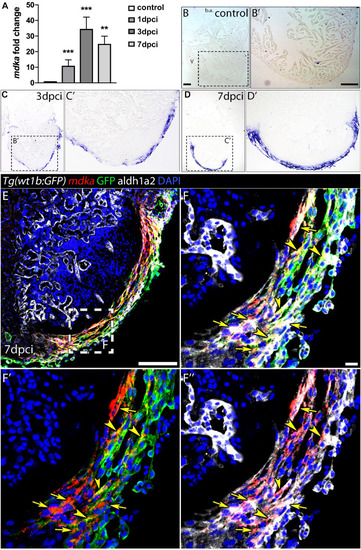
Transcriptional profiling of regenerating |